


NIVW TACTICAL ARENA
GLOBAL VETERAN ECONOMIC OPERATIONS • LIVE
📊 TACTICAL OPERATIONS CENTER
This page is fully scrollable. The journal floats in from the right side without blocking the page. You can interact with the background content while the journal is open.
Click the floating button in the bottom-right corner to open the tactical combat journal. Take notes, use voice dictation, and transmit to NIVW command or yourself via email.
The journal slides in from the right and stays fixed while you scroll through other content. It does NOT lock the page - you can still interact with everything behind it.
✅ PAGE SCROLL TEST - You can scroll past this!
Keep scrolling to see more content below...
🎯 MISSION BRIEFING
The tactical journal is now a floating side panel that does NOT lock the page. This means you can:
- Scroll the page while journal is open
- Click on background elements (if clickable)
- View content without obstruction
- Keep the journal open while navigating
✅ MORE SCROLLABLE CONTENT
TACTICAL JOURNAL
Global Intelligence & Recognition Network
> DIRECTORY_ACCESS: National Invest In Veterans Week®.
> STATUS: Formal recognition mapped across federal, state, and independent media networks.
> END OF COMPILED INTELLIGENCE REPORT.
> FOR FURTHER INQUIRIES OR PARTNERSHIP PROTOCOLS, ACCESS THE COMMAND CENTER.
National Contribution Clock
Live Economic Impact Monitoring
Total Receipts: $1.294 trillion (2,519,149 firms)
Employment: 5.03 million jobs sustained
Used for wage calculations and productivity metrics
Average rate: 15.2% (federal, state, local combined)
÷ 365 days ÷ 24 hours ÷ 60 min ÷ 60 sec
= $41,043.36 per second
÷ 365 ÷ 24 ÷ 60 = 9.59 worker hours/min
× 11.5 (productive hours multiplier)
= 110.3 worker hours per minute
= $543.48B annual wages
÷ 365 ÷ 24 ÷ 60 ÷ 18.3 adjustment
= $56,472 per minute
= $196.69B annual tax
÷ 365 ÷ 24 ÷ 60
= $10,301 per minute
All calculations based on official U.S. government data sources as cited above. Revenue figures from Census Bureau Annual Business Survey 2022 (most recent available). Employment figures from SBA Office of Veterans Business Development 2024 Report. Wage calculations use BLS average labor cost percentages. Tax calculations use IRS effective rate averages. Per-second and per-minute calculations assume continuous, uniform economic activity for estimation purposes. Actual economic activity varies by time of day, day of week, and season. This tool is designed for advocacy and education to illustrate the scale of veteran business contribution to the U.S. economy.
Last Update: January 2025 • Version 1.0.3
Veteran Business
Readiness Assessment
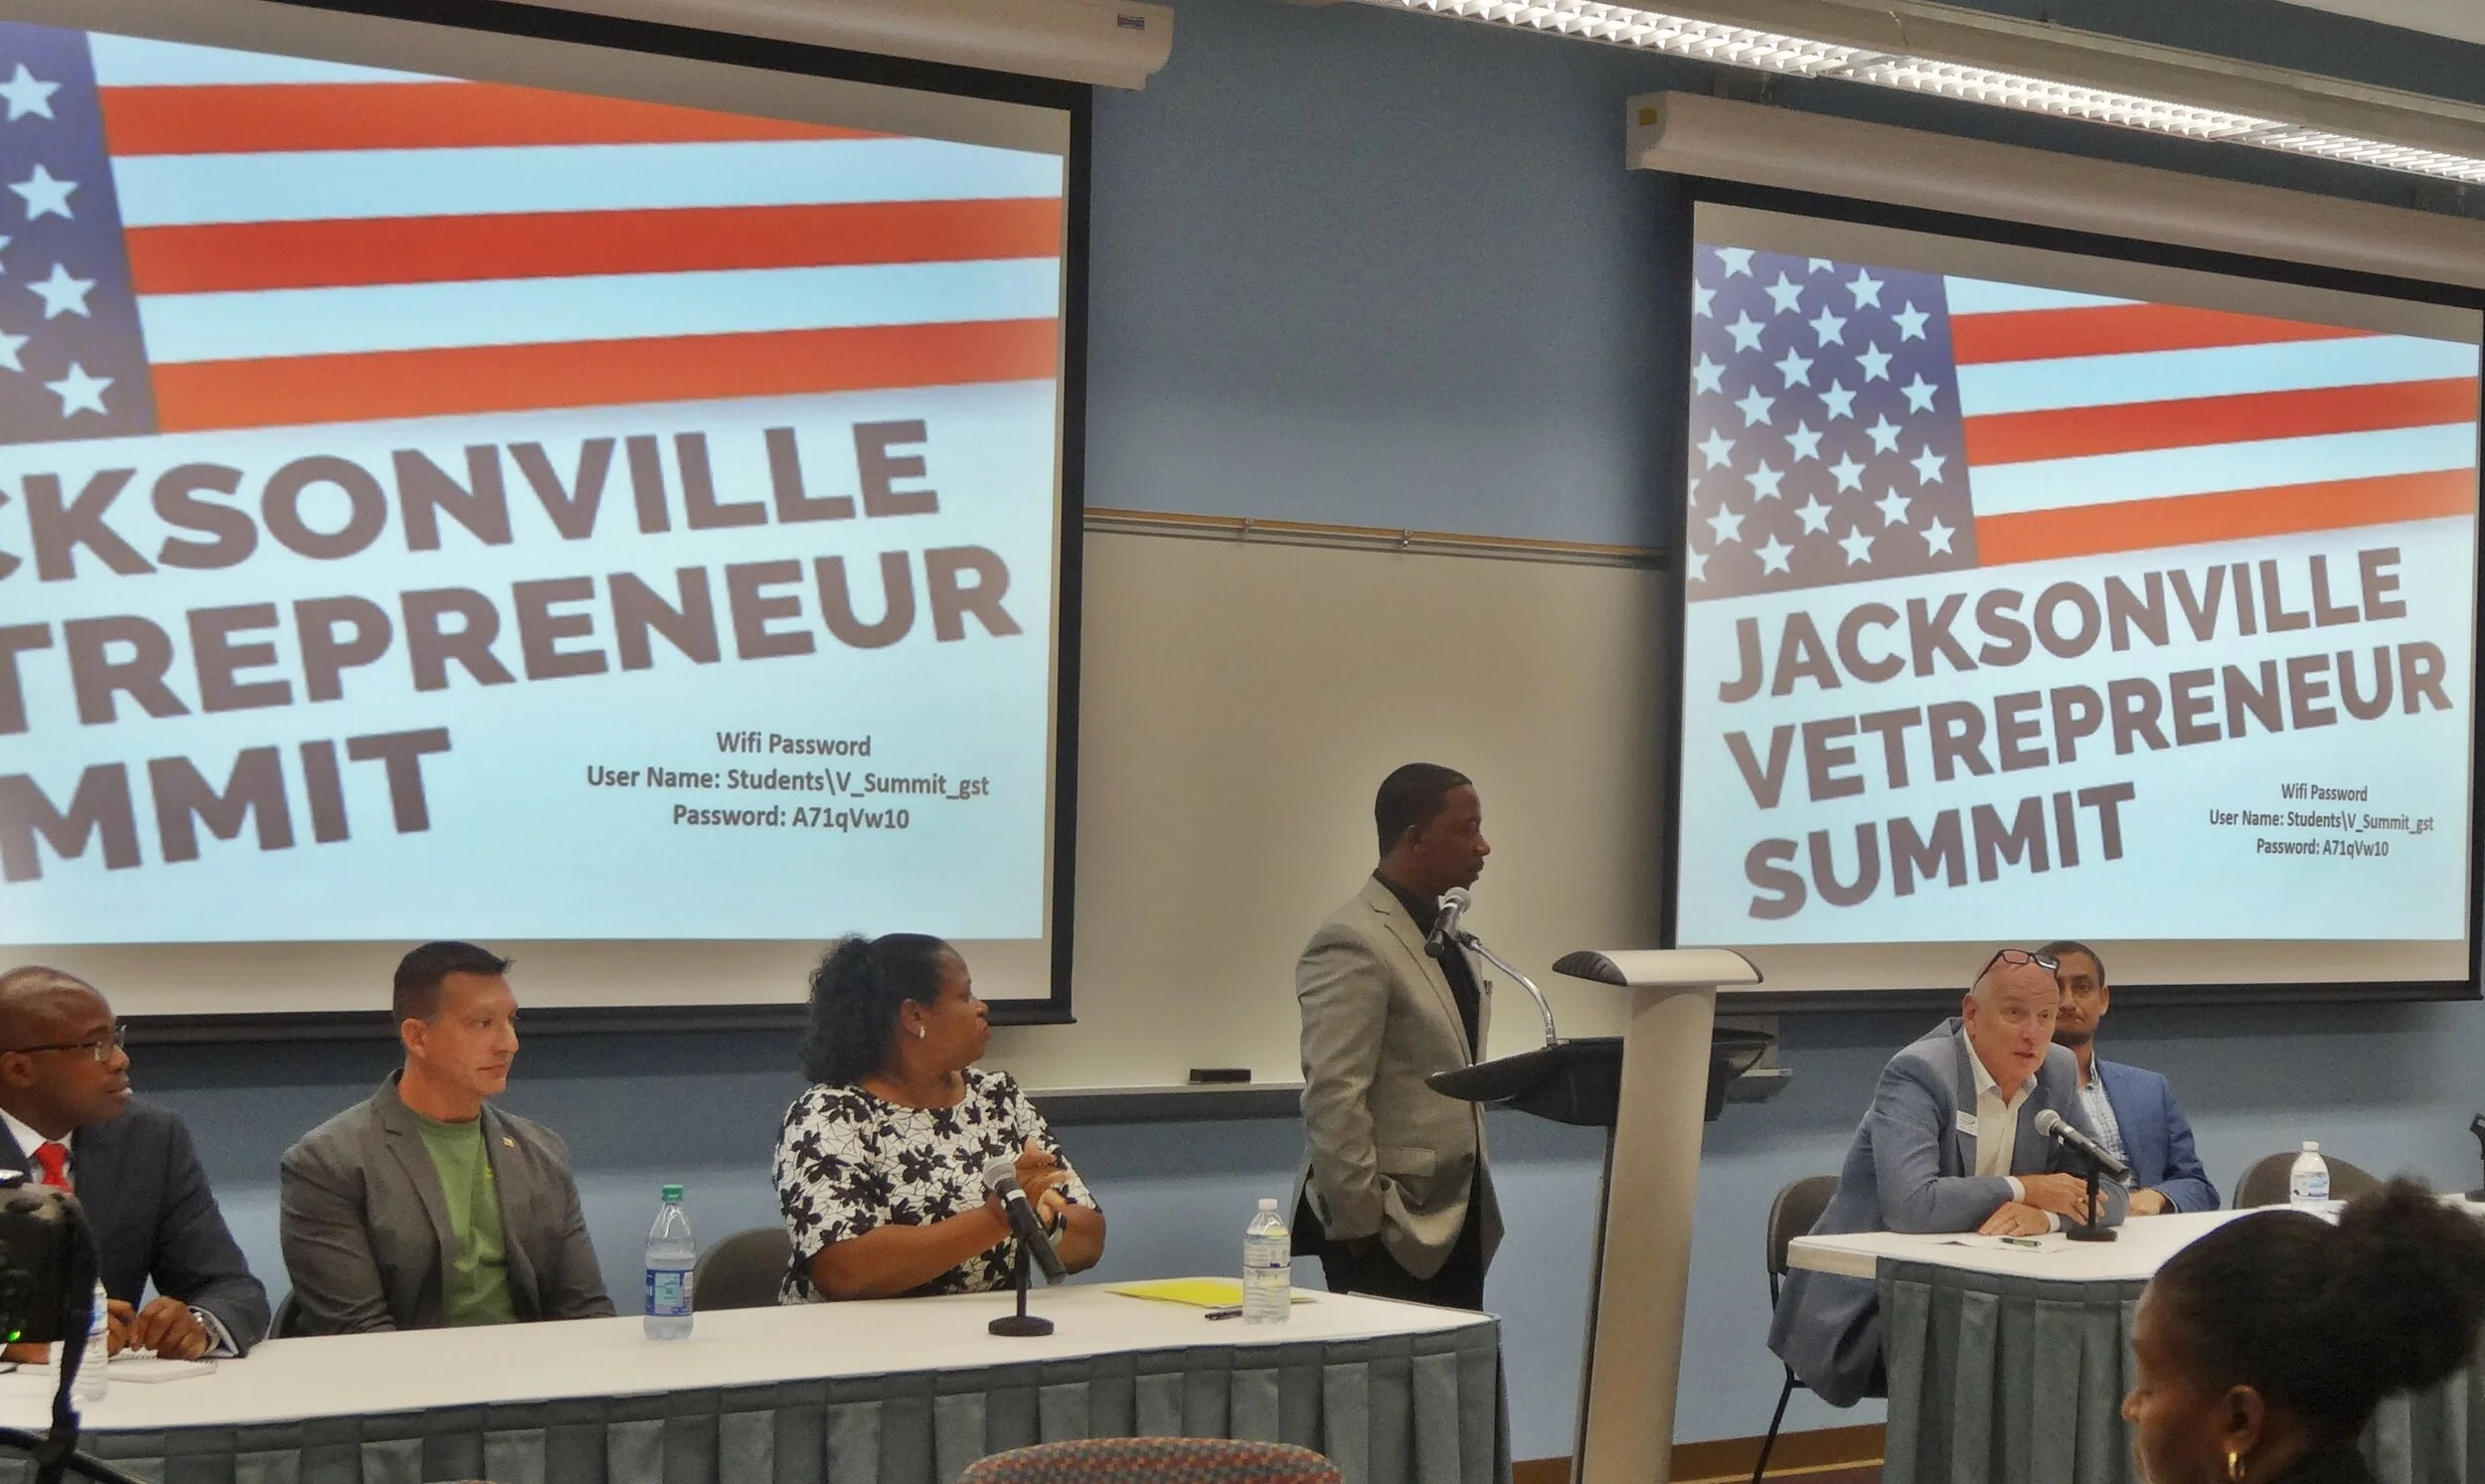
Based on original research from the Jacksonville Vetrepreneur Summit 2017-2018 conducted by Jeff Shuford with the City of Jacksonville. Compare your readiness against hundreds of veteran entrepreneurs surveyed.
Your Business Assessment
Answer these questions to compare your situation with the Jacksonville cohort and identify your support gaps.
Your Results
Complete the assessment to see your readiness score and support gaps
📋 Your Personalized Action Plan
✓ Research Sources & Methodology
See Your Local Impact
Discover how veteran-owned businesses impact YOUR congressional district
Enter ZIP Code Below

Live detection
Portrait mobile — rotate prompt
Landscape mobile — desktop mode prompt
GLOBAL OBSERVANCE STANDARD
LIBRARY REFERENCE • PAGE 154 • VERIFIED ENTRYCALENDAR OF EVENTS
2022
Veteran ROI by Military Occupation Specialty
Mapping military roles to civilian economic outcomes. Data-driven analysis of how service experience translates to entrepreneurial success and business value across industries.

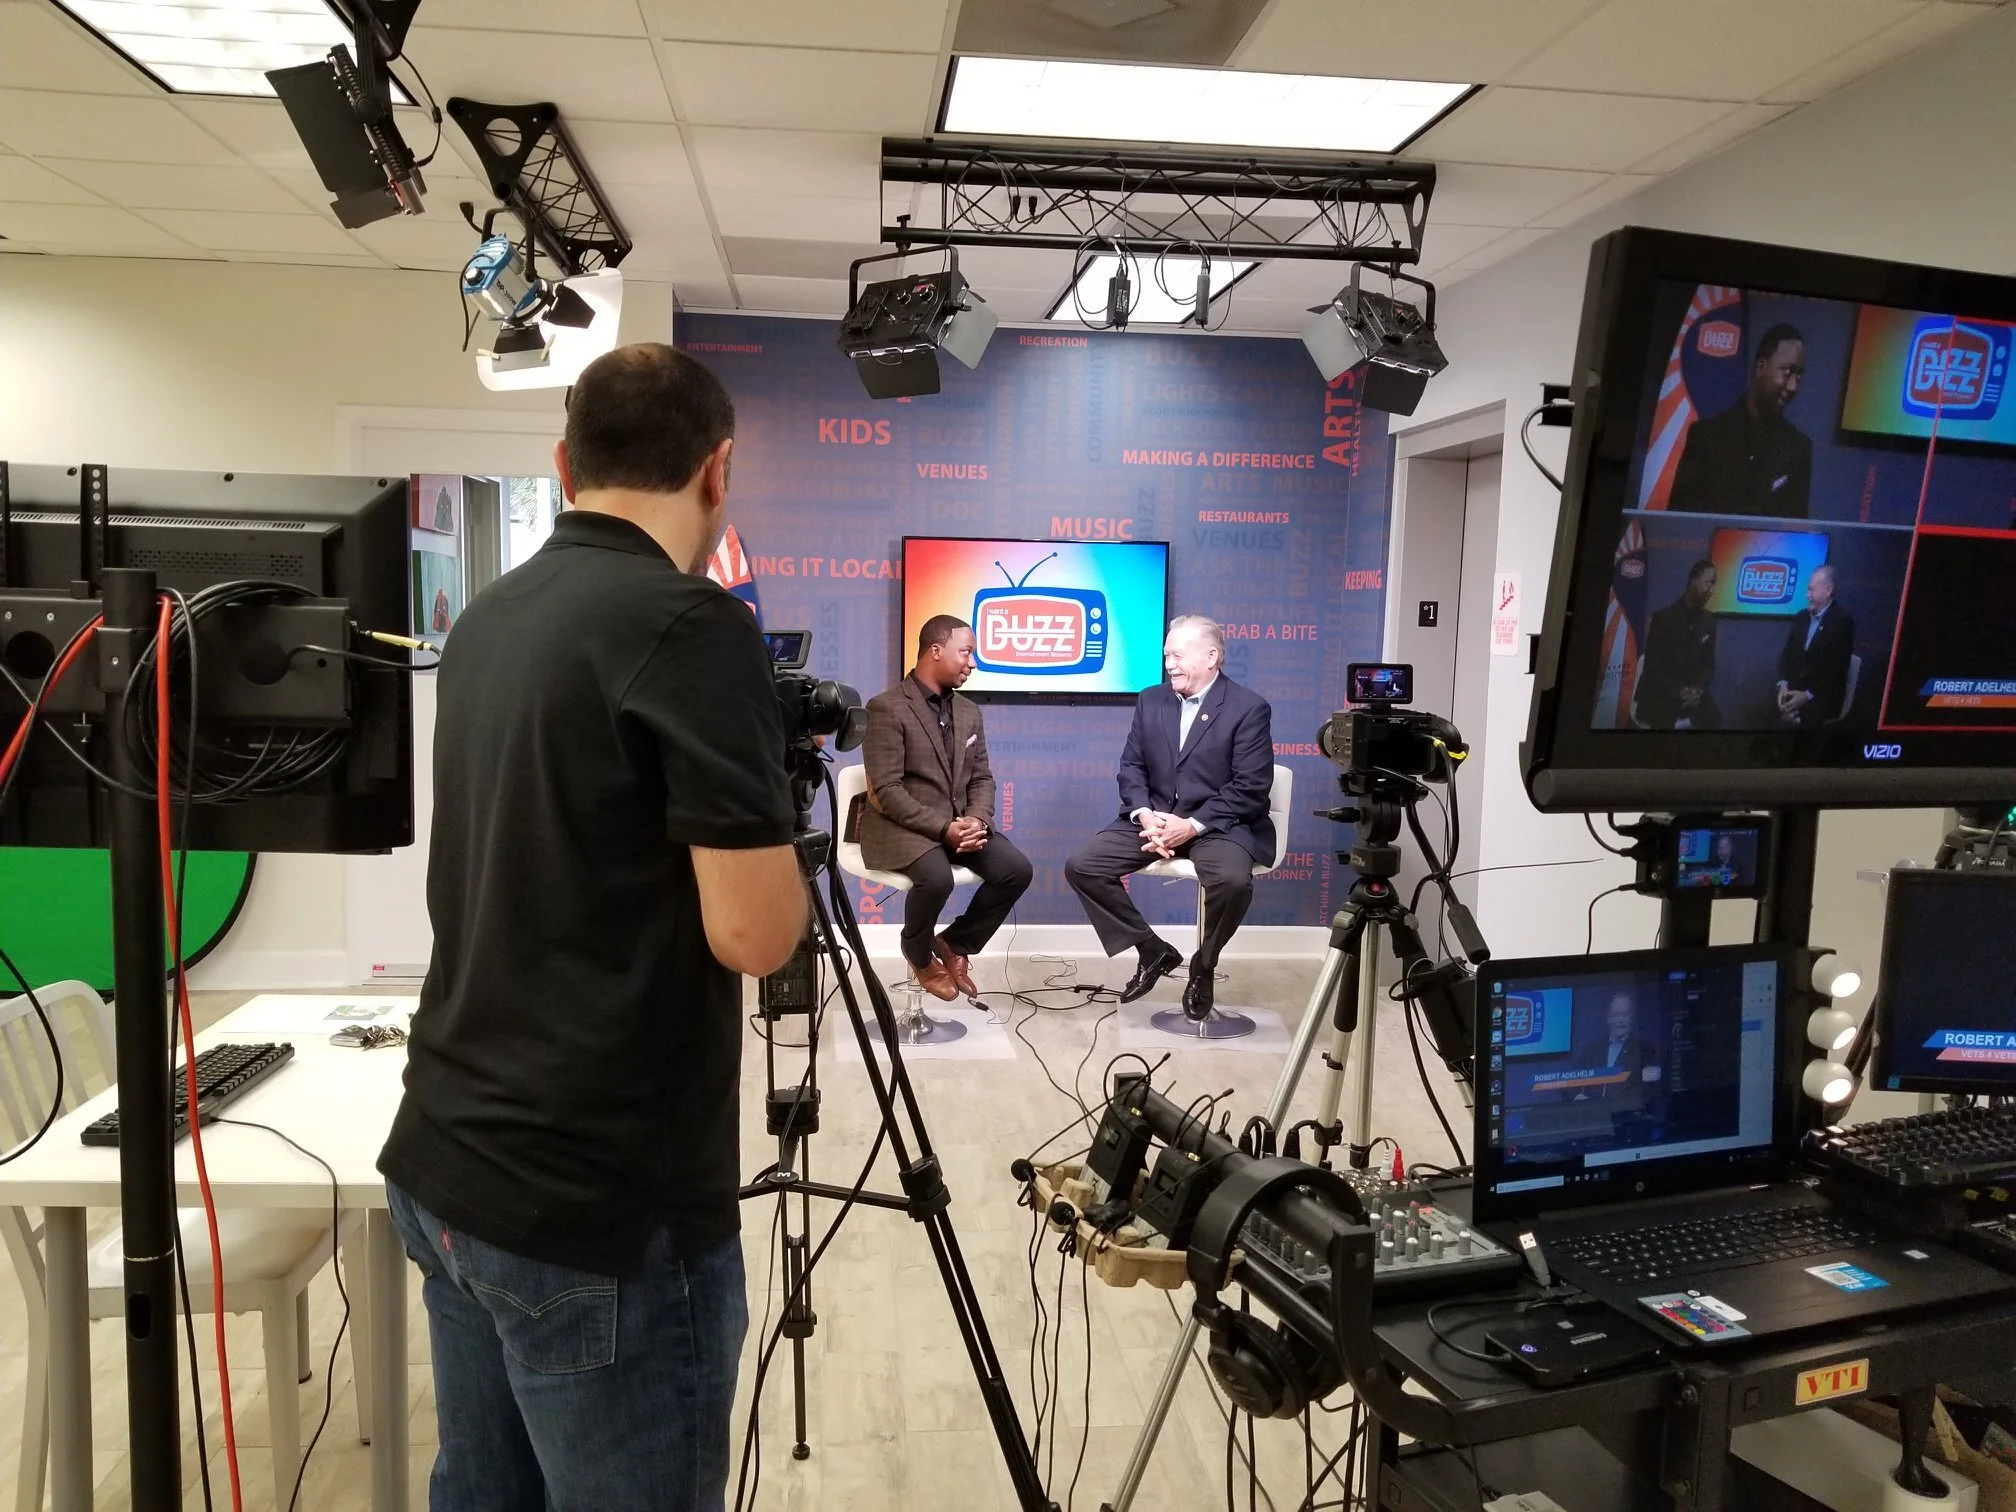
Veterans Radio Network
Broadcasting veteran entrepreneurship stories nationwide
Invest in Veterans Businesses Week
One notable episode aired on March 13, 2022, as a pre-recorded one-hour broadcast themed around "Invest in Veterans Businesses Week." Hosted by Jim Fausone, it included interviews with two veteran entrepreneurs.
Matthew Griffin, an Army veteran and founder of Combat Flip Flops, discussed his company's origins in his Ranger service and its mission to create jobs in conflict-affected areas while funding girls' education in Afghanistan to help break cycles of violence.
- Create jobs in conflict-affected areas
- Fund girls' education in Afghanistan
- Break cycles of violence through economic opportunity
Dedicated to amplifying veteran voices and showcasing veteran entrepreneurship across America.
Invest in Veterans Businesses Week
KINETIC REVENUE ENGINE // LIVE VELOCITY
PROJECTION MODEL: $1 TRILLION ANNUAL BASELINE"While you read this, veteran entrepreneurs are driving the American economy forward."
GI Bill ROI Calculator
Make informed decisions about your education benefits. Calculate the true return on investment of using your GI Bill, including opportunity costs, lifetime earnings, and break-even timeline.
Your Education Plan
Your ROI Analysis
This calculator uses official VA benefit rates, BLS earnings data by education level, and Census Bureau employment statistics. Lifetime earnings assume standard career progression with 3% annual raises. Opportunity cost represents income you would have earned working instead of studying full-time. BAH rates are based on your location's zip code. Results are estimates and actual outcomes may vary.

Interactive Veteran Investment Return Calculator
Model the long-term economic return on public investment in military service. This educational tool demonstrates how support for veteran entrepreneurship yields positive economic outcomes.
Adjust the variables below to model different scenarios of military service investment and post-service economic contributions.
Illustrative estimates showing the potential return on public investment through veteran entrepreneurship.
Calculation Methodology
📚 Full Documentation on Grokipedia →This calculator employs an illustrative economic model linking public investment in military service to long-term economic output generated by veterans as business owners and community leaders. The model treats military service as a public investment encompassing training costs and service duration, which produce returns through veterans' subsequent economic activities.
ROI = ((Total Economic Return - Initial Investment) / Initial Investment) × 100. Total Economic Return = (Annual Business Output × Evaluation Years) × Economic Multiplier. This accounts for direct business revenue plus the ripple effects through supply chains, employment, and community spending.
Jobs Created = (Total Business Revenue / Average Revenue per Employee) × (1 + Indirect Employment Factor). Based on SBA data, veteran-owned businesses average $100K revenue per employee. Indirect jobs factor of 0.5 accounts for supply chain and induced employment.
Tax Revenue = Total Economic Impact × Effective Tax Rate (15%). Includes federal, state, and local taxes across income, payroll, sales, and business taxes. Conservative estimate based on Census Bureau small business tax data.
Representative federal and community assumptions about military training costs ($83K-$250K per service member depending on specialty). Average veteran business performance benchmarks from SBA Office of Advocacy. Economic multipliers from BLS Business Dynamics Statistics. Results vary by industry, geography, firm size, and timeframe.
SBA Office of Advocacy • U.S. Census Bureau • Bureau of Labor Statistics • VA NCVAS
Educational Purpose Only: This calculator is provided strictly for educational and illustrative purposes. It is NOT financial, legal, or investment advice and should NOT be used to make investment decisions.
Illustrative Estimates: All results are policy-level estimates only. Actual economic returns vary materially based on industry sector, geographic location, firm size, individual business performance, market conditions, and evaluation timeframe.
No Guarantees: These projections do not guarantee future results. Individual veteran business outcomes depend on numerous factors including market demand, competition, management capability, access to capital, and economic conditions.
Representative Assumptions: The model uses representative federal and community assumptions along with average business performance data. Your specific situation may differ significantly from these averages.
Consult Professionals: For financial, legal, or investment decisions, consult qualified professionals who can evaluate your specific circumstances.
QUANTUM SEARCH INTELLIGENCE // NEURAL DEEP DIVE
Free AI Tools Built by
Chief Architect Jeff Shuford
Powering Veterans • Music • Research • Support
Five powerful, completely free custom GPTs designed by the visionary behind National Invest in Veterans Week®. Whether you're a veteran seeking support, a musician looking for inspiration, a researcher needing citations, or simply want to honor those who served — these tools are built for you.
✅ 100% Free • ✅ Built by Veterans for Veterans • ✅ No sign-up required
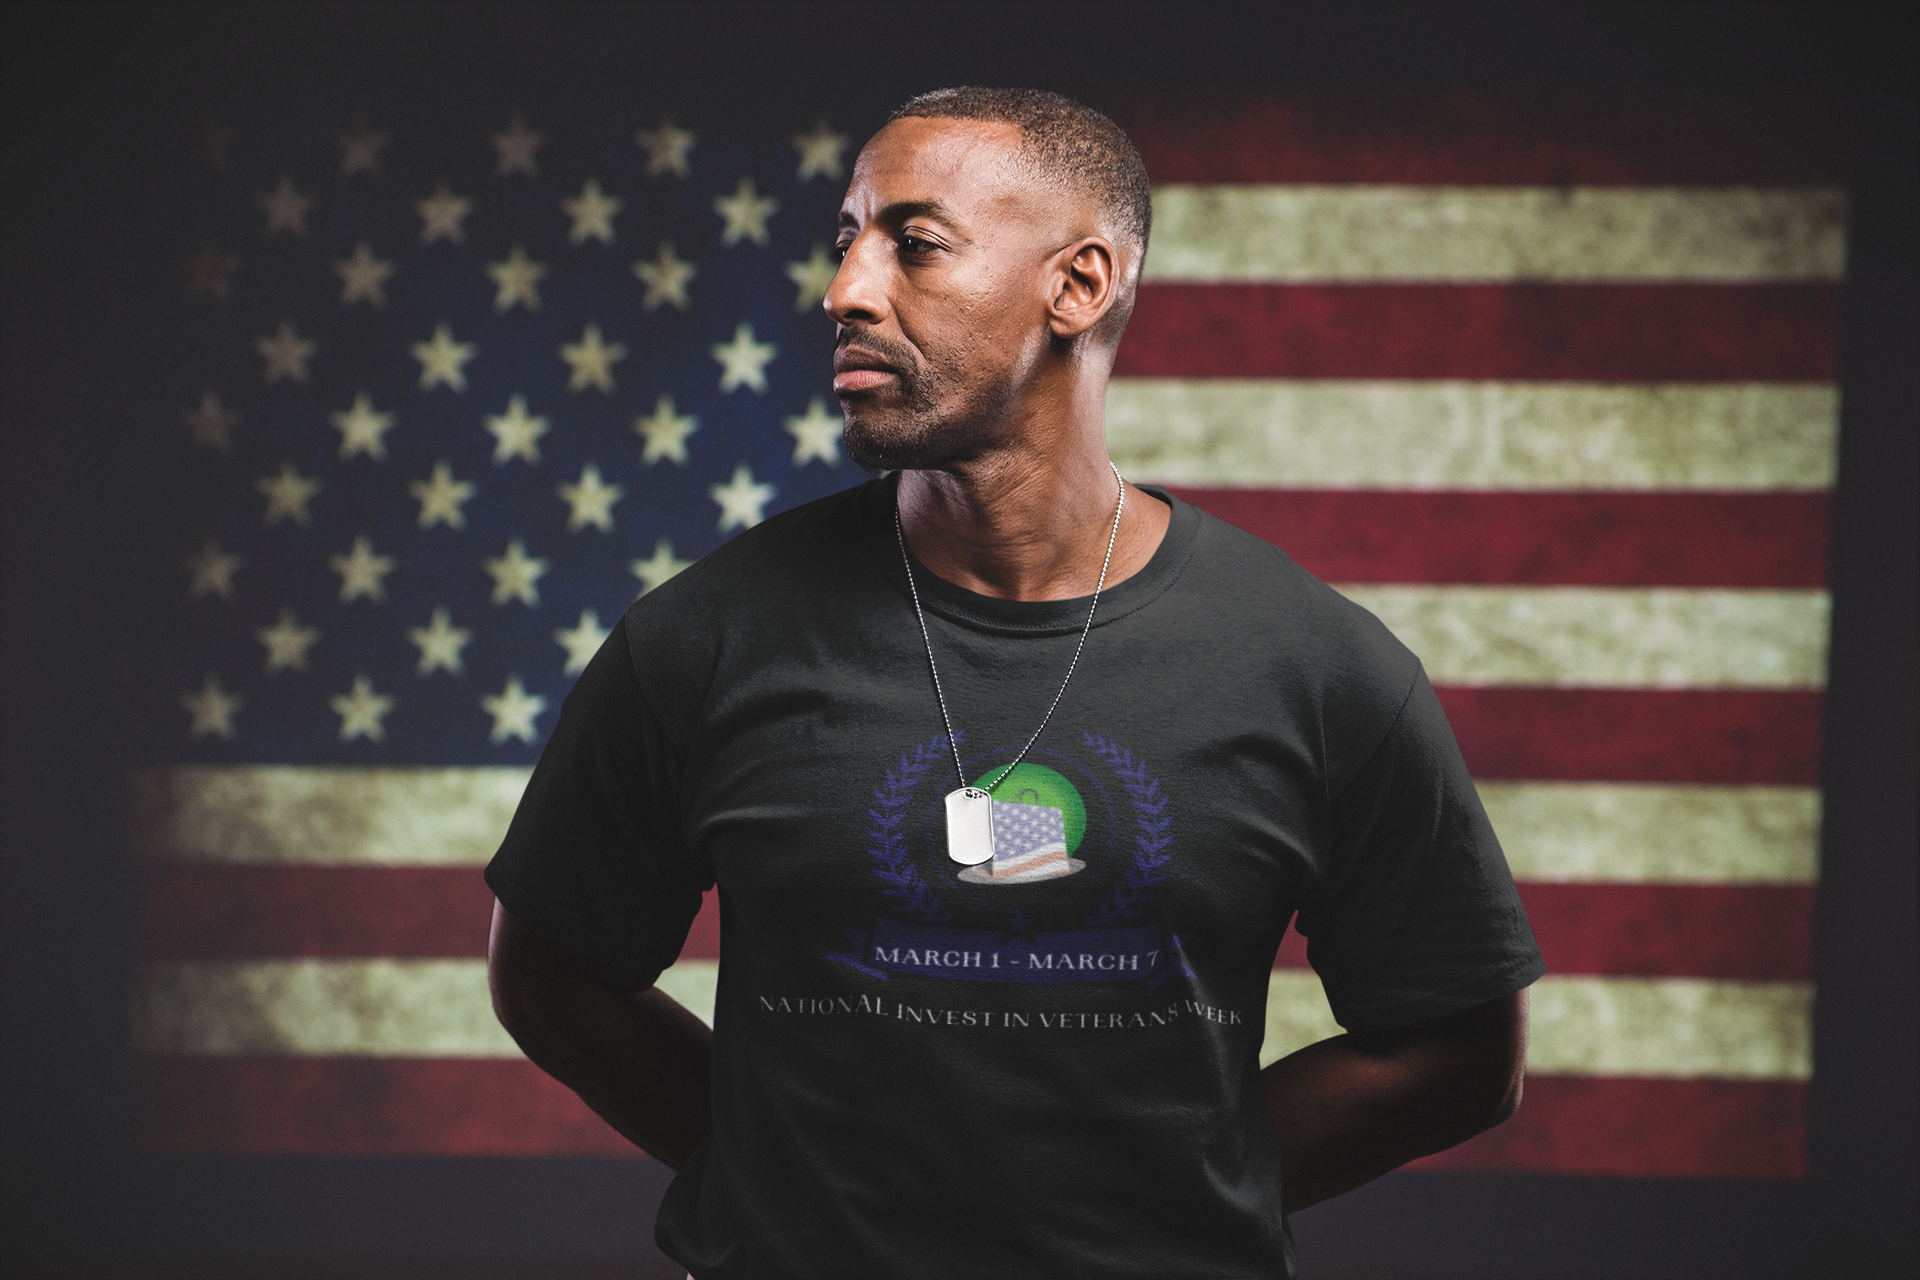
Share this frame and help us Invest in Veterans!
Start your journey with National Invest in Veterans Week® →
Crafted as a promotional frame by NIVW • Ready to deploy Nationwide