
Financial Impact Advocates
-
![Berkshire Bank logo featuring a stylized gold and gray emblem and city skyline outline with clouds]()
Berkshire Bank
“Today marks the final day of Invest In Veterans Week, and we want to take a moment to recognize the important work being done by Purple Heart Homes. Founded in 2008, Purple Heart Homes is a non-profit organization that works to provide housing solutions to veterans and their families who are in need.”
-
![Logo of Origin Bank featuring a circular graphic with four blue segments and the text 'Origin Bank' below.]()
Origin Bank
“It's #InvestInVeteransWeek + we're proud to share we have a Hero Mortgage program for veterans + other community heroes that waives admin + processing fees on home loans. THANK YOU to those who have served!“
-
![Logo of Ameris Bank featuring a red lion's head and the text 'AMERIS BANK' in blue.]()
Ameris Bank
“Your service, sacrifice and patriotism make our nation great. Your experience has a place at Ameris Bank. #InvestInVeteransWeek”
-
![Logo of AllSouth Federal Credit Union with a stylized bird in red, white, and blue colors on a dark blue background.]()
AllSouth Federal Credit Union
"Did you know: March 1-7 is National Invest in Veterans Week! This week honors aspiring and established veteran business owners and their contributions to the economy.”
-
![Fort Bragg Federal Credit Union logo with text and a silhouette of a person sitting.]()
Fort Bragg Federal Credit Union
“The FHLB is offering a grant of up to $10,000 towards down-payment or closing costs on qualifying VA purchases! #InvestInVeteransWeek.”
-
![AFBA logo with snowflake design]()
Armed Forces Benefit Association
“Whether celebrating the week or empowering veterans to start and grow their business enterprises, there are many ways to observe and celebrate National Invest In Veterans Week.”
-
![Stylized logo with a dark blue background, featuring interconnected white letters 'S' and 'B'.]()
Southside Bank
“The first week of March is National Invest in #Veterans Week, designed to support the efforts of veterans building lives for themselves and their families through their work and businesses.”


Real-Time Veteran-Founded Company Performance
What industries show the strongest veteran entrepreneurship patterns?
-
Utilities shows the highest share of veteran-owned firms (veteran ownership representation is highest in this sector).
-
Professional, Scientific, and Technical Services has the most veteran-owned employer businesses.
-
The SBA infographic highlights elevated veteran ownership shares in Finance & Insurance, Management of Companies and Enterprises, Manufacturing, Agriculture, and Mining/Oil & Gas relative to the all-sector baseline.

Government Impact Advocates
-
![Pennsylvania Department of Agriculture logo with a stylized farm landscape and text.]()
Pennsylvania Department of Agriculture
“In celebration of National Invest in Veterans Week, the Bucknell SBDC recognizes Robert Showers, founder of Abe's Custom Woodworking.”
-
![Lexington Chamber & Visitors Center logo with a stylized boat and circular design]()
Lexington Chamber
"𝗡𝗮𝘁𝗶𝗼𝗻𝗮𝗹 𝗜𝗻𝘃𝗲𝘀𝘁 𝗜𝗻 𝗩𝗲𝘁𝗲𝗿𝗮𝗻𝘀 𝗪𝗲𝗲𝗸 𝗵𝗮𝘀 𝗼𝗳𝗳𝗶𝗰𝗶𝗮𝗹𝗹𝘆 𝗯𝗲𝗴𝘂𝗻! This week is all about honoring aspiring and established veteran business owners and their contributions to the economy.”
-
![Sign for Workforce Wyoming Services against a partly cloudy sky]()
Wyoming Department of Workforce Services
“#NationalInvestInVeteransWeek: March 1-7 is National Invest In Veterans Week. This is a week-long celebration to honor the men and women who have selflessly served our country and now lead in business.”
-
![Pennsylvania Department of Labor & Industry logo with stylized blue graphic and text.]()
PA Department of Labor & Industry
“This week is #NationalInvestInVeteransWeek! #Pennsylvania offers many resources that allow veterans to build their skill sets + transition to civilian life.”
-
![Logo of the South Dakota Department of Labor & Regulation with a stylized letter R in gray, gold, and dark gray colors.]()
South Dakota Department of Labor and Regulation
“National Invest In Veterans Week March 1 - 7th is a Veteran-owned, award-winning social impact organization dedicated to advocating for Veteran entrepreneurs nationwide.”


Veteran Business Ownership by the Numbers
Veteran vs. Civilian Business Ownership Share (U.S.)
QUICK LINKS


Veteran Charity Impact Advocates
-
![Virginia Department of Veterans Affairs logo on a blue background]()
"National Invest In Veterans Week March 1 - 7th is a Veteran-owned, award-winning social impact organization dedicated to advocating for Veteran entrepreneurs nationwide."
Detroit VA
-
![Logo for Hancock County Veterans Service Office with silhouetted figures and stars]()
"National Invest in Veterans Week takes place annually March 1-7 and was established to empower the public to celebrate and support the economic contributions of veterans in the United States."
Hancock County Veterans Service Office
-
![Logo of the Wisconsin Department of Veterans Affairs, with the acronym WDVA and an outline of Wisconsin in red.]()
“March 1-7 is National Invest in Veterans Week! Show your support for local, veteran-owned businesses here in Wisconsin during National Invest In Veterans Week! The Wisconsin Department of Veterans Affairs recognizes the important role that veteran-owned and disabled veteran-owned businesses play in the Wisconsin economy.“
Wisconsin Department of Veterans Affairs ·
-
![DeVry logo with the tagline 'Keeping Our Promise to America's Veterans']()
""Post-Traumatic Stress Disorder is a leading contributor to the homelessness of nearly 40,000 American veterans. Another 1.4 million are at-risk. Today marks the beginning of "National Invest in Veterans Week", and DAV encourages veterans to invest time in their mental wellbeing and we remind you that it is okay to need help."
DAV
-
![Logo for Bunker Labs featuring a lightbulb with a fighter jet inside.]()
"During this #NationalInvestInVeteransWeek, check out our marketplace full of 60+ #veteran & #militaryspouse made products. While it's no longer the holidays, it's always time to invest in veterans and yourself or a friend!."
Bunker Labs


Veteran Business Trends
Veteran vs. Civilian New Business Starts U.S. (2019–2024)
Just For You
-
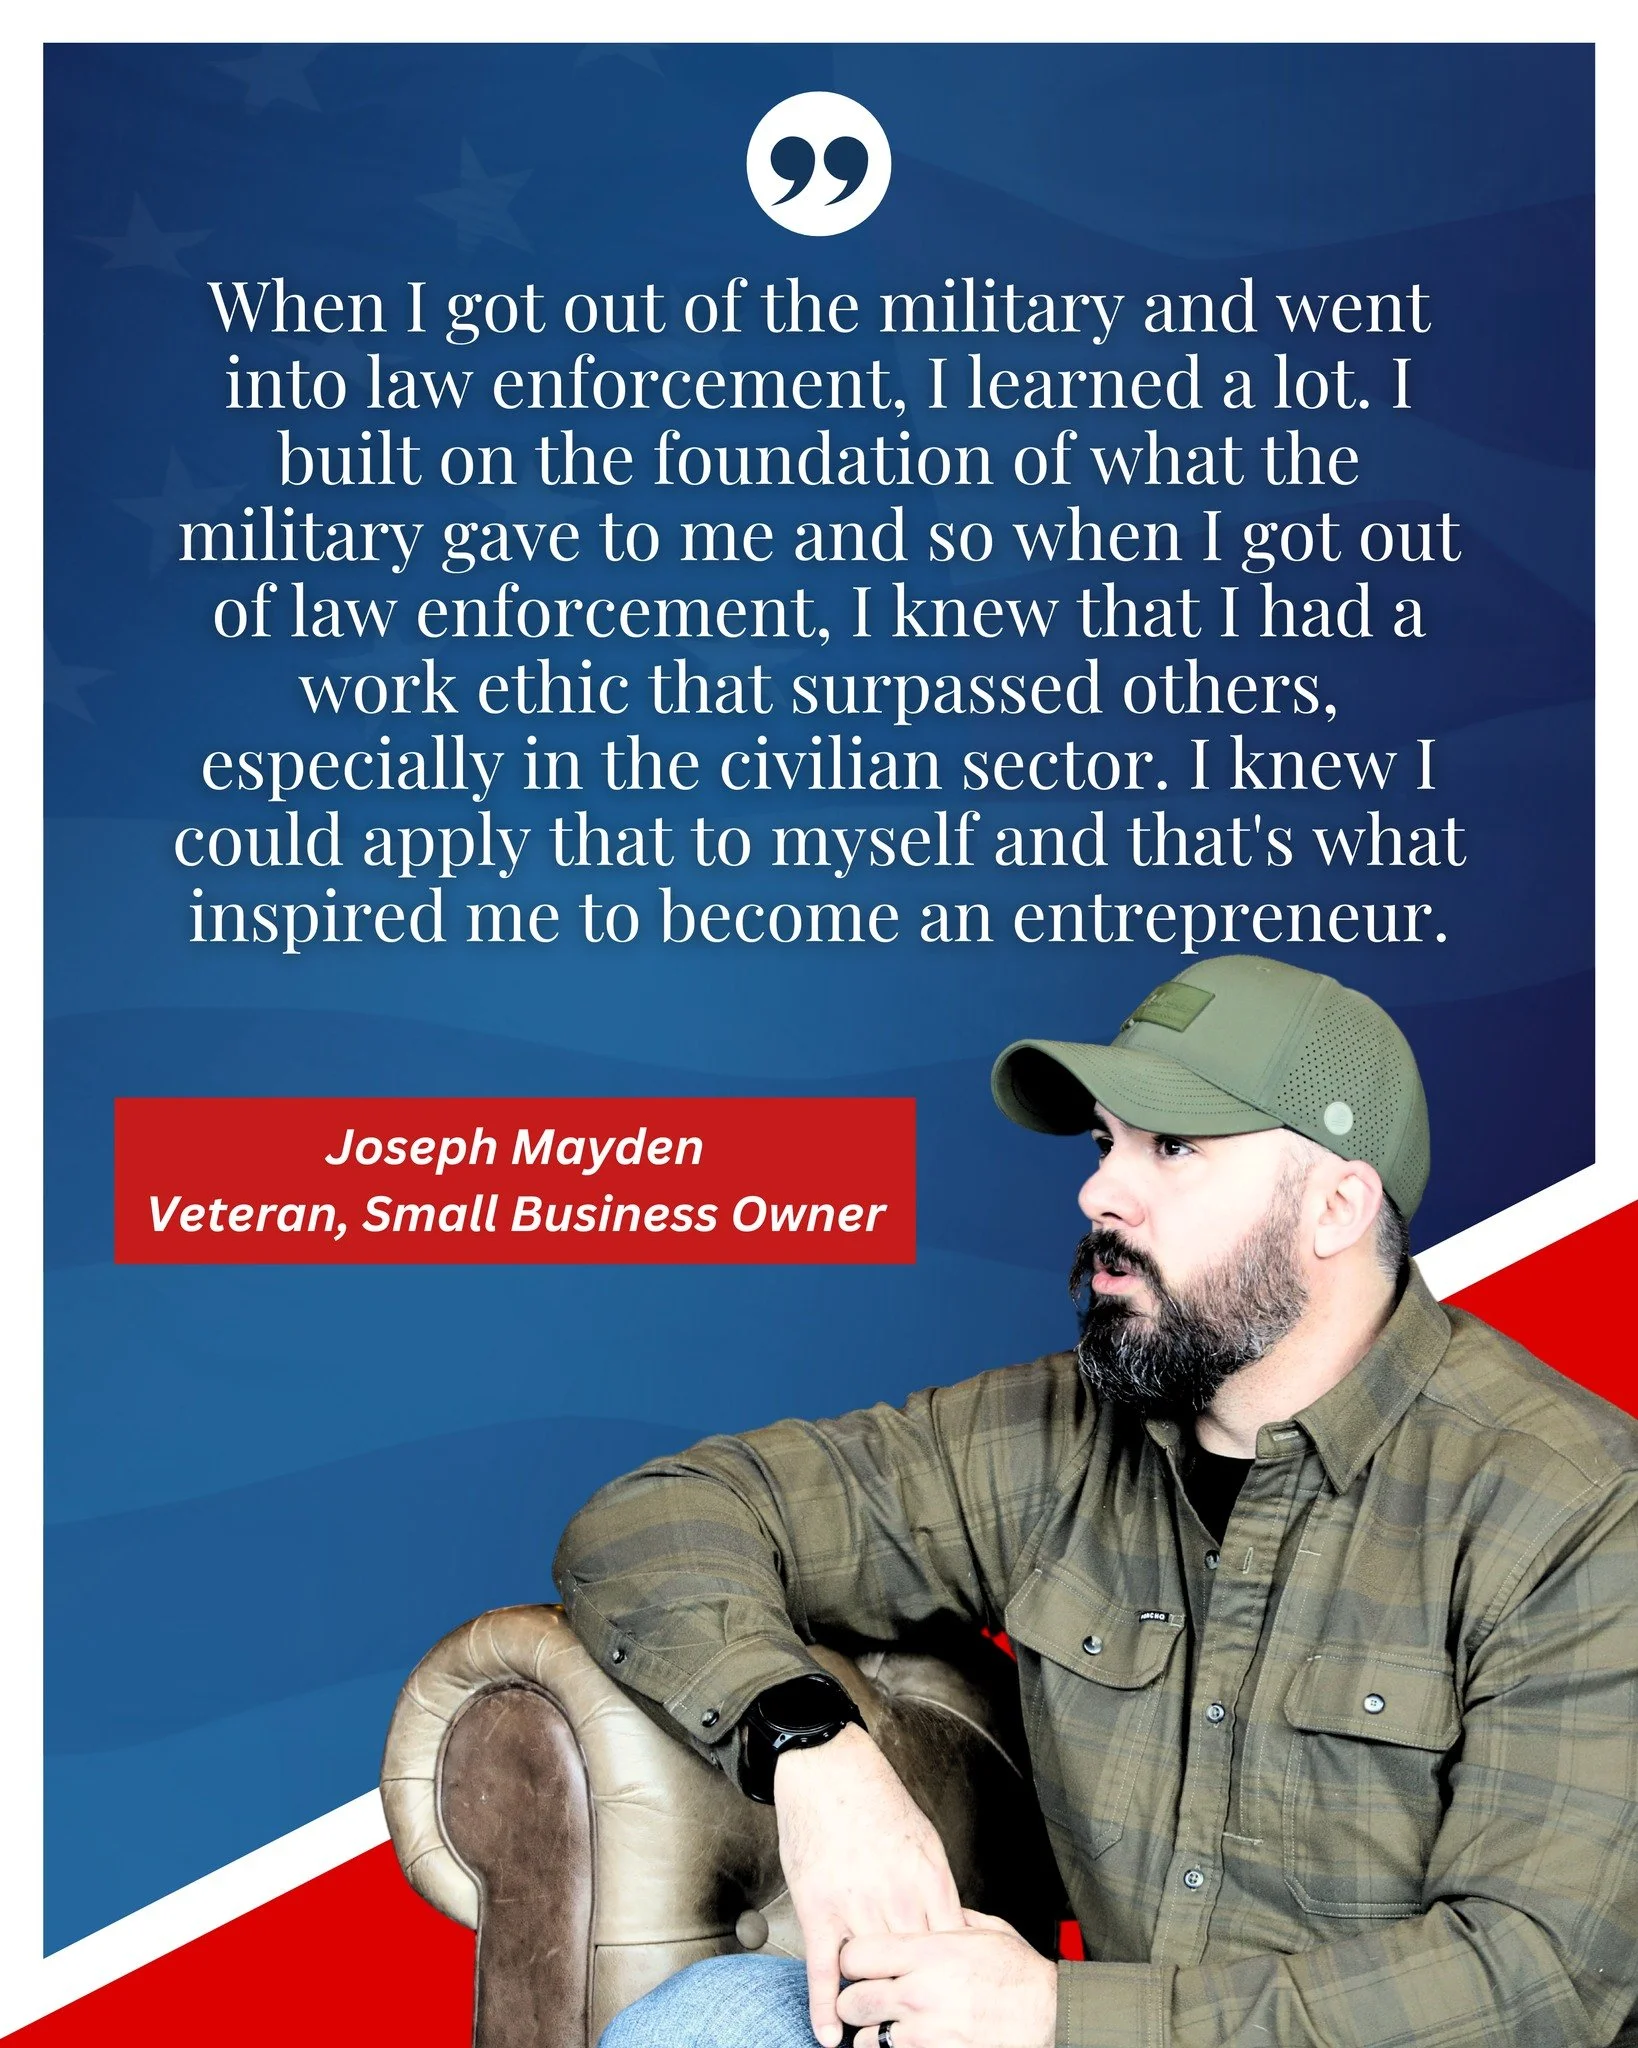
Written By Chynelle Washington
Humans at the Helm: How AI Is Being Used to Find America’s Next Veterans
-
Long-time Public Address (PA) Announcer for the Anaheim Ducks NHL Team
“In the arena, we cheer for heroes.
In the economy, we invest in them.”
— Phil Hulett -
Phil Hulett Elevates National Invest In Veterans Week®
“Don’t Just Cheer for Veterans—Invest in Them”: Phil Hulett Elevates National Invest In Veterans Week®
MARCH 1-7
Veteran Employer + Nonemployer Business Counts (U.S., 2022)

Corporate Business Impact Advocates
-
![Logo of The Reis-Davis Graduate School in Los Angeles, California, featuring black and light blue colors with the initials RDGS in the center.]()
Reiss-Davis Graduate School
“Reiss-Davis Graduate School recognizes National Invest in Veterans Week (March 1-7, 2023). We asked noted veterans advocate and editor-in-chief of the Journal of Veterans Studies, Mariana Grohowski, PhD, to share her thoughts on advancing the cause of veterans and their families.”
-
![Indiana University Purdue University Indianapolis Military Family Research Institute logo]()
Military Family Research Institute
“The first week of March is National Invest in #Veterans Week, designed to support the efforts of veterans building lives for themselves and their families through their work and businesses.”
-
![Close-up of bold black and white abstract design with large letter 'E' and 'U'.]()
EnergyUnited
“Today marks the final day of Invest In Veterans Week, and we want to take a moment to recognize the important work being done by Purple Heart Homes. Founded in 2008, Purple Heart Homes is a non-profit organization that works to provide housing solutions to veterans and their families who are in need.”
-
![Cintas logo with the slogan 'Ready for the Workday']()
Cintas Corporation
“It's National Invest in Veterans Week! At Cintas we are proud to be a Top Veteran-Friendly Company and are committed to recruiting military talent. For all the sacrifices they have made, we are dedicated to providing opportunities for Veterans to succeed.”
-
![Logo for GCA Gary/Chicago International Airport, with the airport's abbreviation and full name.]()
Gary/Chicago International Airport
“Happy #NationalInvestInVeteransWeek! Back in November, GYY received the prestigious HIRE Vets Medallion Award, an honor bestowed by the @USDOL for our efforts to create jobs that recruit, employ and retain veterans’ who have served our country!”
-
![Logo of Armed Forces Vacation Club with a stylized eagle head and text.]()
Armed Forces Vacation Club
"#DidYouKnow it's National Invest In Veterans Week? National Invest In Veterans Week is observed every year from March 1 through March 7. This is a week where we support and honor aspiring and established veteran business owners!”
-
![Columbia Gas of Ohio logo]()
Columbia Gas of Ohio
“We're proud to support our veterans, and especially those on our team! #InvestinVeteransWeek is a good reminder to invest in veterans after all they've invested in our country.”
-
![Logo of the National Academy of Sciences featuring a stylized human figure inside a gold circle with the organization name below.]()
National Academy of Sciences
“#DYK It’s #NationalInvestinVeteransWeek! In this touching #TheScienceBehindIt video, meet Ray, Casey, and Raymond as they share their coming home stories and talk about the challenges facing millions of veterans.”
-
![Waubonsee Community College logo with red, black, and white shield, and the college name in a circular layout]()
Waubonsee Community College
“#Waubonsee is proud to serve those students who have served our country, and we'll do everything we can to streamline the process, start you on the right foot, and support your endeavors every step of the way. #NationalInvestInVeteransWeek”


Economic Impact: By the Numbers
-
Average Revenue per Business 💵
Calculation
Total Revenue: $922.2 billion
Number of Businesses: 304,823
Average Revenue per Business: $3.03 million
Formula: Total Revenue ÷ Number of Businesses
📊 Result
Each veteran-owned business generates an average of approximately $3.03 million in revenue annually.💡Insight
This figure highlights the impressive revenue capacity of veteran-owned businesses across the country, underscoring their economic impact and resilience. -
Average Revenue per Business 💵
📐 Calculation
Total Revenue: $922.2 billion
Number of Businesses: 304,823
Average Revenue per Business:$3.03 million
Formula: Total Revenue ÷ Number of Businesses
📊 Result
Each veteran-owned business generates an average of approximately $3.03 million in revenue annually.💡 Insight
This figure highlights the impressive revenue capacity of veteran-owned businesses across the country, showcasing their economic impact and contribution. -
Average Employees per Business 👥
📐 Calculation
Total Employees: 3.3 million
Number of Businesses: 304,823
Average Employees per Business: 11 employees
Formula: Total Employees ÷ Number of Businesses
📊 Result
Each veteran-owned business employs an average of about 11 people.
-
Veteran-Owned Business Averages
💵 Average Revenue per Business
$3.03 million
👥 Average Employees per Business
11 employees
📊 Average Payroll per Business
$590,195
---
Source: U.S. Census Bureau. (2023, March 16). Annual Business Survey provides data on employer business characteristics. Census.gov. https://www.census.gov/newsroom/press-releases/2023/annual-business-survey-employer-business-characteristics.html
Quick Links
Veteran-Owned Business Economic Output (Receipts)