Inside the NIVW℠ Data-Driven Command Surface
For decades, the national conversation surrounding military transition has been anchored in charity and support. While well-intentioned, this narrative routinely overlooks a measurable reality: veterans are valuable economic assets in the United States. To demonstrate the economic impact of veteran entrepreneurs, National Invest In Veterans Week® (NIVW) has deployed an interactive economic dashboard.
What you get on the new homepage is a live, embedded command surface. You land, interact, and export. By translating military experience into measurable macroeconomic data, the platform shifts the narrative toward structural economic investment.
Based on a functional walkthrough, here is what is built into the platform, module by module:
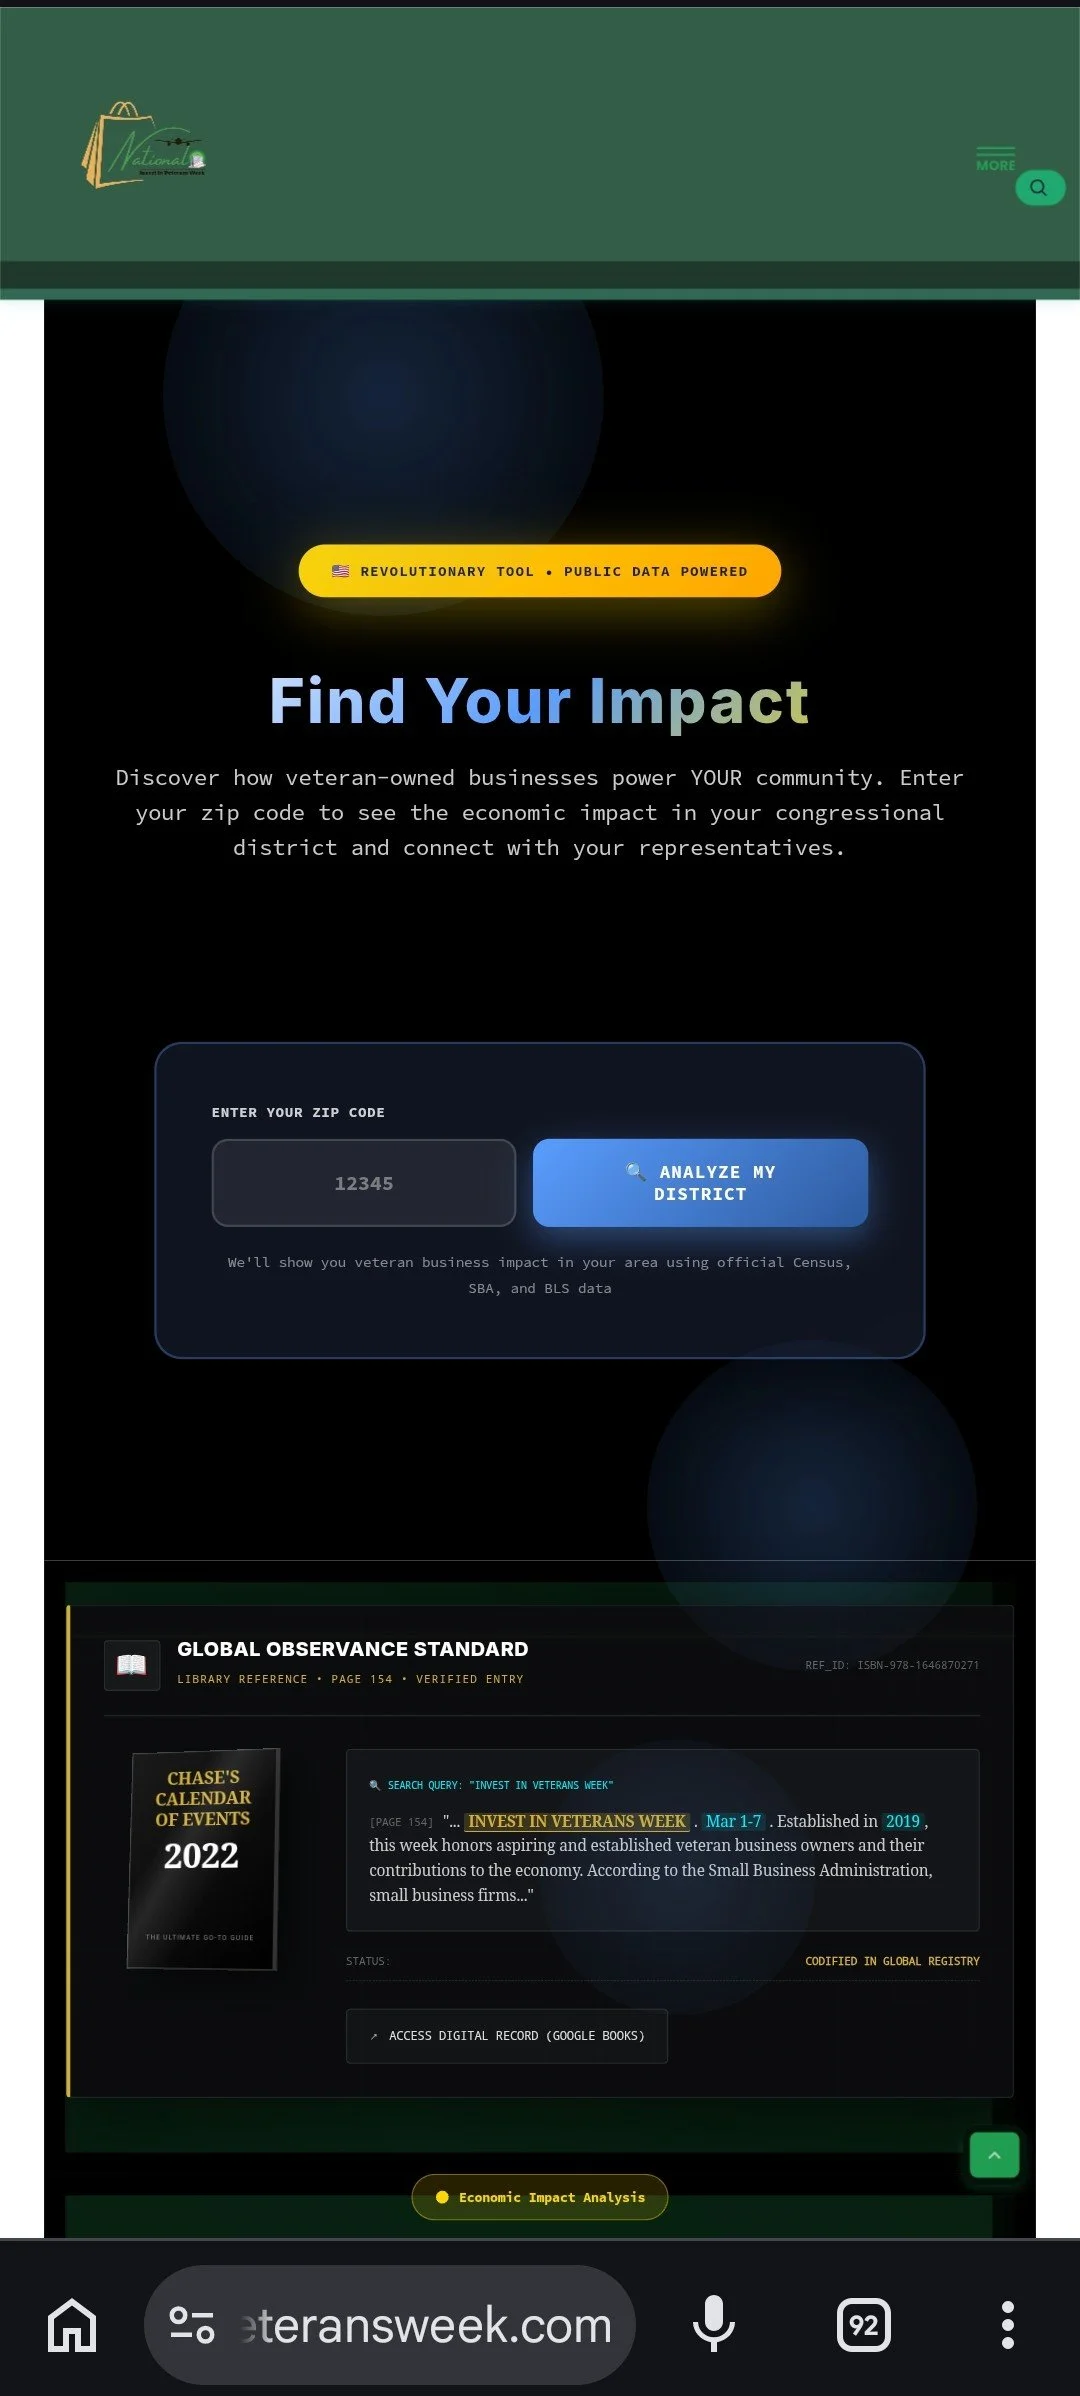
1. Find Your Impact (The Zip-to-District Engine)
Advocacy relies on local application. At the top of the interface, users can type in a zip code and hit "Analyze My District." There is no separate login or redirect.
It returns a detailed district card:
Four KPI Tiles: Veteran-Owned Businesses, Jobs Created, Annual Economic Impact, and Tax Revenue Generated. Each tile lists its source underneath (Census Bureau Annual Business Survey 2024, BLS Economic Data, IRS effective 2024), providing a policy-neutral baseline.
A Comparison Strip: "How Your District Compares" features three horizontal bars (Veteran Business Density, Job Creation Rate, Economic Impact Per Capita), each shown as a percentage of the national average.
Auto-Populated Representatives: The system dynamically loads separate cards for your local House member and both state Senators. Every card features a routing button—"Contact NIVW for Advocacy Support"—linking data to civic action.
The Action Container: Built like a briefing box, it includes options to "Share This Report," "Download PDF," and "Get Advocacy Support" so users can export the data.
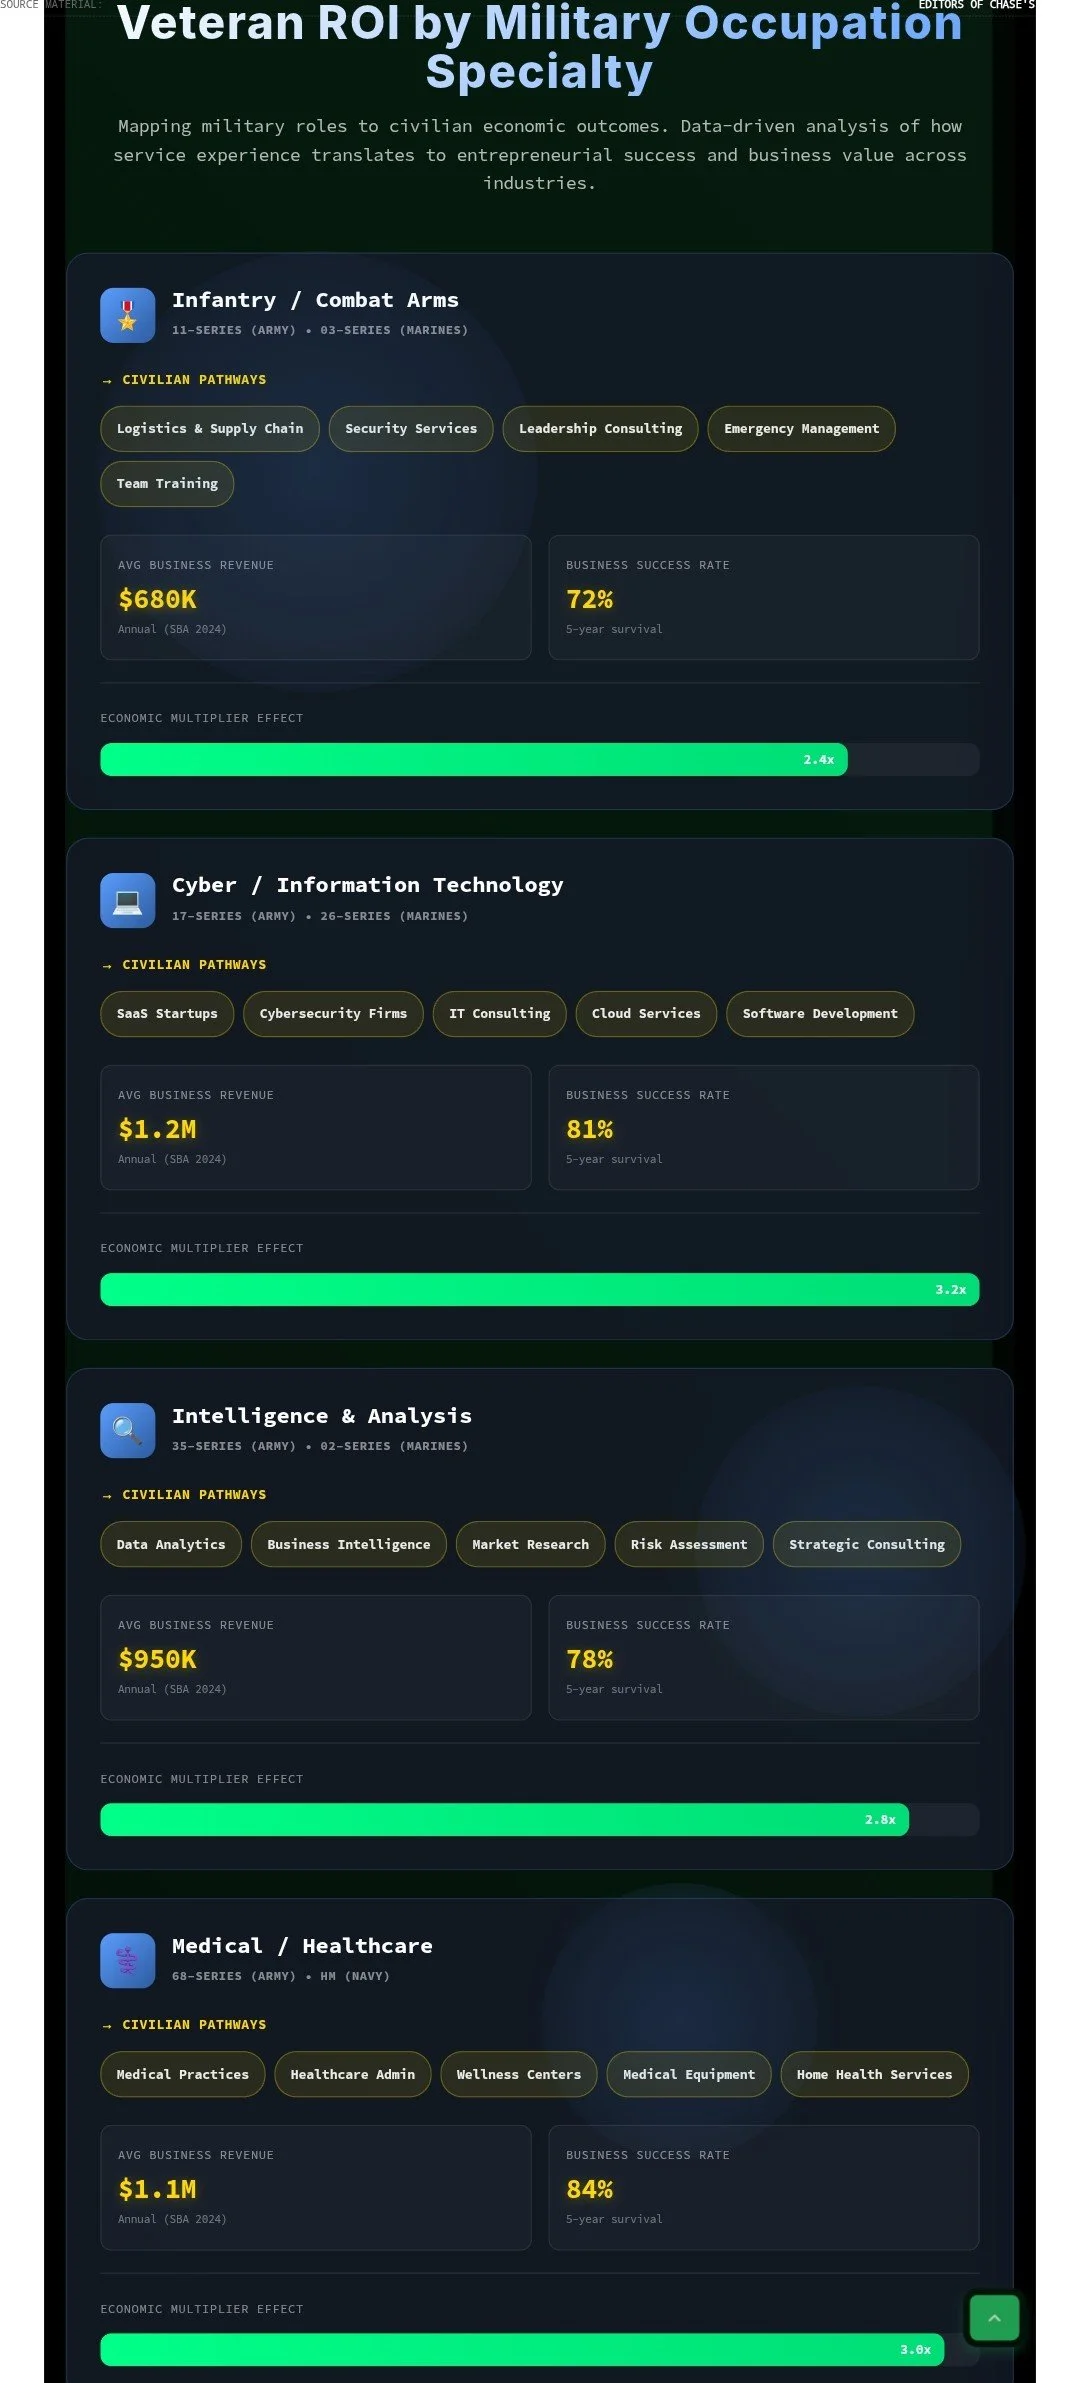
2. Veteran ROI by Military Occupation Specialty (MOS)
A common misconception is that combat skills do not translate directly to corporate roles. This tool functions as a taxonomy mapper to address this, rather than a standard list. You scroll and engage with six MOS families:
Infantry / Combat Arms
Cyber / Information Technology
Intelligence & Analysis
Medical / Healthcare
Engineering / Technical
Aviation / Aerospace
Inside each card are "civilian pathway chips" (e.g., Logistics & Supply Chain, Security Services, Leadership Consulting), alongside an average revenue figure and a 5-year survival rate using visual progress bars. A collapsible "Data Sources & Methodology" section outlines the framework.
3. GI Bill ROI Calculator: Objective Education Data
This is a financial model, rather than a standard benefits estimator. It models the projected upside and potential downside of education choices.
The inputs include:
Dropdowns: GI Bill type (Post-9/11, Montgomery, Voc Rehab Chapter 31).
Buckets: Degree level and specific program fields (STEM, Business & Finance, Healthcare, Education, Liberal Arts, Skilled Trades).
Sliders & Fields: Current age, current annual income, and BAH location.
The tool outputs a projected lifetime return on investment percentage, a categorization tag, and a breakdown of total GI Bill value, opportunity cost, and break-even timeline. By showing that a STEM certificate might yield a +4,000% ROI while another degree path might project a negative return, the tool provides a realistic range of outcomes.
4. Interactive Veteran Investment Return Calculator
Built for policymakers, staffers, and advocates, this acts as a macroeconomic policy simulator. It features five interactive sliders:
Initial Public Investment
Service Duration
Post-Service Annual Business Output
Post-Service Evaluation Period
Economic Multiplier Effect
As you adjust the variables, the right panel updates Economic Impact Projections, calculating total return, ROI percentage, and job estimates. A "Calculation Methodology" accordion spells out the formula used, modeling how funding veteran initiatives acts as an economic investment.
5. Kinetic Revenue Engine | Live Velocity
At the base of the command surface is a live ticker designed to visualize static Census data. Three numbers tick upward: year-to-date veteran business revenue, current per-second velocity, and daily average. It is dynamic data visualization, giving the user a sense of scale.
Purpose-Driven UX: A "Veteran-First" Digital Experience
The platform uses a deliberate UX design. It utilizes a black terminal background, monospace fonts, and amber accent buttons. The card-based layout collapses for mobile users.
A footer toggle allows users to switch between "Civilian Mode" and "Combat Mode," adjusting the contrast and UI elements.
The tools function as the homepage. The National Invest In Veterans Week platform is a practical example of civic tech, organizing veteran economic data and making it accessible to the public.
Further Reading & Resources
Jacksonville Vetrepreneur Summit: https://grokipedia.com/page/Jacksonville_Vetrepreneur_Summit
Vets 22: https://grokipedia.com/page/Vets_22
Interactive Veteran Investment Return Calculator: https://grokipedia.com/page/Interactive_Veteran_Investment_Return_Calculator
Angel Shuford: https://grokipedia.com/page/Angel_Shuford
Jeff Shuford: https://grokipedia.com/page/Jeff_Shuford