Corporate Business Impact Advocates

Vetrepreneur Intelligence
VETERAN BUSINESS SUPER INTELLIGENCE℠ · SPONSORED BY NATIONAL INVEST IN VETERANS WEEK®-- ET · -- · Records through Oct 22, 2026
Vetrepreneur Intelligence · Advocate Tracker

Vetrepreneur Intelligence

When public officials stand up for veteran-owned business, what happens to them at the ballot box?

What the record showsBacking the week carried no electoral penalty. Advocates won at the same rate as incumbents in the same races: .
Not proven yetThat backing the week causes wins. Incumbents usually win anyway, so a lift needs about comparable races to detect. The record has . Every new proclamation adds to the sample.

Advocates vs. every incumbent in the same races

Each pair compares Invest In Veterans Week advocates with all incumbents who sought reelection to the same body in the same year. Bars start at 0%.

Invest In Veterans Week advocatesAll incumbents (baseline)

South Carolina's whole 124-member House co-sponsored H. 3825, so its sponsors and its incumbents are nearly the same people; that pair shows no penalty but cannot show a lift. The 2022 U.S. House pair is marked "same era" because the Advocate Atlas posts are undated (2019 to 2023), so those races may have come before the posts.

Verification lab

Observed vs. expected wins

Expected wins apply each race's baseline rate to every advocate race. A big gap would point to an advocate effect.

Proof meter

Comparable races are advocate races outside the South Carolina House, where most incumbents are not advocates and so form a real comparison group.

Sample size to detect a 3-point lift over a 94% baseline (one-sided 5% test, 80% power).

Where advocates lose

Reelection losses by South Carolina sponsors. Most came in party primaries, not general elections.

Primary or runoffGeneral election

Leadership reach

Where advocates sit now. These posts shape veteran and small-business policy, procurement and defense spending.

Advocate tracker: in and out of office

Every elected official on record outside the South Carolina roll call, plus four South Carolina sponsors who changed roles. Star an advocate to build your own watch list on this device.

From support to the ballot box

Each row is one advocate. The gold mark is the dated show of support (a faint bar where the Advocate Atlas post is undated, 2019 to 2023). Circles are later races; a hollow ring is a race on the Nov 3, 2026 ballot.

Support on recordWonLostAdvanced from a primaryDid not run

Election Day watch: November 3, 2026

Advocates on the ballot

Who is on the ballot outside the SC House

AdvocateRace

How big they win

Vote share in each advocate's latest win

General elections, except Douglas County, where a commissioner who tops 50% in May wins outright. The darker line marks 50%.

Votes won

Votes each advocate received in their latest winning general election. South Carolina House sponsors are not included.

South Carolina: all 124 sponsors of H. 3825

On February 4, 2021, the full South Carolina House (81 Republicans and 43 Democrats) co-sponsored the concurrent resolution celebrating National Invest In Veterans Week with the Lexington Chamber. The Senate adopted it on February 11, 2021 by voice, without a roll call. Each dot is one sponsor; hover or tap for the record.


2026 status of the 75 still serving

Sponsors still holding a House seat

Full roster

SponsorRecord

Where the advocates are

Who they are

Party as listed in public election records. Nebraska's Legislature and Oregon county boards are nonpartisan. Veteran status from public biographies.

Add an advocate

Know an official who proclaimed the week, sponsored a resolution or spoke for it on the record? Send it in. Each new advocate adds another race to the proof meter.

Send to info@investinveteransweek.com

Open in email

If the email link does nothing, copy the message and the address.

Method and definitions

Advocate
An elected or appointed official who put National Invest In Veterans Week on the public record: a proclamation, a resolution, a floor statement, an official post or an on-air feature.
Reelection bid
An incumbent seeking the same office after a dated show of support. A primary loss counts as a loss. Bids for a different office are tracked separately as higher-office bids.
Same era
Races held while the support date is unknown. Advocate Atlas posts span 2019 to 2023 without dates, so only races from 2024 on count for those advocates.
Baseline
All incumbents who sought reelection to the same body that year: SC House (Ballotpedia), U.S. House (Brookings Vital Statistics; Princeton), state legislators and state executives nationwide (Ballotpedia).
Expected wins
The sum of each race's baseline win rate. The z-score compares observed and expected wins using the variance of independent races.
Proof meter
Comparable races divided by the sample needed to detect a 3-point lift over a 94% baseline at 5% significance and 80% power.
SI (Super Intelligence)
A public intelligence system built from government datasets and documentary evidence, with analytical interfaces layered over the data.

Sources: SC H. 3825 (2021); SC State House member pages and 2026 resolutions H. 5627, 5629, 5631; Ballotpedia candidate and election pages (SC House 2022, 2024, 2026; U.S. House members; state legislators); Wikipedia election pages (2026 SC House; SC governor 2026; MT governor and secretary of state 2024; MI attorney general 2022; IN Senate 2022; OK governor 2022; WA lands commissioner 2024; MD attorney general 2026; PA Senate 2026); Congressional Record H1049; mast.house.gov; KQEN and The News-Review; Montana Governor's proclamations 2023 to 2026; Montana Free Press; Utah News Dispatch; newhouse.house.gov; Fox News, Mar 5, 2023; war.gov; Ripon Forum, Veterans Day 2025; Brookings Vital Statistics on Congress; Princeton JPIA; Ballotpedia News incumbency reports; Invest In Veterans Week Advocate Atlas.

Compiled October 22, 2026. Nonpartisan record of public facts. Not affiliated with or endorsed by any official listed, and not an endorsement of any candidate. Correlation is not causation. Veteran Business Super Intelligence℠ · Sponsored by National Invest In Veterans Week® · Content CC BY 4.0, Jeff Shuford · veteranbusiness.si

Veteran Owner Diversity Datasets
VETERAN BUSINESS SUPER INTELLIGENCE℠ · SPONSORED BY NATIONAL INVEST IN VETERANS WEEK®OPEN DATA RELEASE 2026.10.22 · CC BY 4.0 · 5 DATASETS
Vetrepreneur Intelligence · Open data

Veteran Owner Diversity Datasets

One in four SBA-certified veteran businesses is Black-owned. One in eight is woman-owned. More than 600 carry a Native American, Alaska Native or Native Hawaiian designation. This release connects those owners across SBA, Federal Reserve, Census, FINRA and IVMF evidence.

Certification is where these owners show up

Share of SBA VetCert certified veteran firms (snapshot 2026-10-04) divided by the same group's share of majority veteran-owned employer firms in the Federal Reserve's 2024 Small Business Credit Survey, which is weighted to the Census Annual Business Survey. A ratio of 1.0 means the same share in both.

The two numbers behind each ratio

Owner groupCertified firmsEmployer firmsRatio

The populations differ: VetCert includes firms without employees and uses self-reported tags; the survey covers employer firms only. The gap is still large enough to matter.

Connections across the datasets

Each card joins a figure from the certified-firm export with a figure from another source.

Certification fingerprint

Share of each group's firms holding each certification or designation. Darker cells are higher within each column.

Program gaps

Who holds two identities

Overlap among women-owned certified veteran firms.

Founding waves

Share of each founding year, certified firms

Firms certified today, grouped by the year they were established. Hover for counts.

Black-ownedWomen-ownedNative-owned

Census: veteran employer firms, 2017 to 2020

Change in firm counts by owner group, from the Annual Business Survey as reported by SBA Advocacy.

Women's share of veteran employer firms rose from 3.8% to 4.4%; minority ownership rose from 10.4% to 13.3%.

Where they are

Top states

Top congressional districts

DistrictGroup firmsAll firmsShare

What they sell

Capability index: the group's share of firms in each line of work divided by the share for all certified firms. Keyword estimates from names and narratives.

How they are built and how visible they are

Legal structure

Visibility to buyers

Share of firms that publish each item, or hide it, in their public SBA profile.

All firmsBlackWomenNative

Capital and resilience context

These sources describe all small employer firms or all veterans, not only certified veteran firms. They show the financing conditions the same owner groups face.

Fully approved for loans, lines of credit or cash advances

Small employer firms that applied, by owner race. Federal Reserve SBCS.

2019 survey2022 survey

Relied on personal savings, friends or family

Small employer firms, past five years, 2022 survey.

Veteran financial resilience

Share of each FINRA Foundation resilience segment that is female or non-white, veterans, 2024.

FemaleNon-white

Evidence crosswalk

IDFindingValuePopulation and periodSource

Dataset catalog

Five datasets, each with a CSV file and a combined JSON file. Free to use with attribution under CC BY 4.0.

Cite this release

Shuford, J. (2026). Veteran Owner Diversity Datasets (Version 2026.10.22) [Data set]. Veteran Business Super Intelligence, sponsored by National Invest In Veterans Week. https://www.veteranbusiness.si/vetrepreneur-intelligence

Method and definitions

Source file
SBA VetCert certified-firm export, snapshot 2026-10-04: 42,114 firms with active Veteran-Owned Small Business certification; 34,319 list a public location.
Black-owned
Profile carries the self-certification tag Black American Owned.
Women-owned
Tag Woman-Owned Business, Women-Owned Small Business or Economically Disadvantaged Women-Owned Small Business, or an active or pending WOSB or EDWOSB certification.
Native-owned
Any of these tags: American Indian Owned, Native American Owned, Native Hawaiian Organization Owned Firm, Indian Tribe (Federally Recognized), Tribally Owned Firm, Alaskan Native Corporation Firm, Indian Economic Enterprise, Indian Small Business Economic Enterprise.
Location quotient
A group's share of firms in a state divided by its share nationally. Above 1.0 means more concentrated than the nation. Computed for states with 20 or more firms and 5 or more group firms.
Capability index
A group's share of classified firms in a line of work divided by the share for all firms. Lines of work come from keyword matches on firm names, trade names and narratives; a firm can match several.
Suppression
Counts under 5 appear as <5 and their shares are withheld. No firm, owner or person is named anywhere in these datasets.
Limits
Tags are self-reported. Groups overlap. Founding-year figures describe firms certified today, not every firm ever started. Benchmarks from other sources cover different populations and years.
SI (Super Intelligence)
A public intelligence system built from government datasets and documentary evidence, with analytical interfaces layered over the data.

Sources: SBA VetCert certified-firm directory export (2026-10-04); Federal Reserve Banks, 2025 Firms in Focus: Chartbook on Veteran-owned Firms (2024 SBCS), pp. 50-51; Federal Reserve Banks, 2023 Report on Employer Firms (2022 SBCS), pp. 17-18; SBA Office of Advocacy, Issue Brief 18, Deconstructing the Change in Veteran Business Ownership (2023); GAO-25-107561, Financial Literacy and Small Business Lending (Sept 2025); FINRA Investor Education Foundation, The Financial Resilience of U.S. Veterans (May 2026); IVMF Research Review on Deming, Carpenter and Anders, Journal of Entrepreneurship and Public Policy (2025).

Veteran Business Super Intelligence℠ · Sponsored by National Invest In Veterans Week® · Data and text CC BY 4.0, Jeff Shuford · veteranbusiness.si

Veteran Founder Relocation Index
VETERAN BUSINESS SUPER INTELLIGENCE℠ · SPONSORED BY NATIONAL INVEST IN VETERANS WEEK®OPEN DATA RELEASE 2026.10.22 · DATASETS · ROWS
Vetrepreneur Intelligence · Relocation

Veteran Founder Relocation Index

Where should a veteran or military spouse launch a business? This index ranks all 50 states on comrades, certified peers, momentum, defense demand, broadband, taxes, veteran jobs, military spouses and Invest In Veterans Week support. Pick a founder profile or set your own weights.

Set your own weights

Each factor is a percentile from 0 (lowest state) to 100 (highest). The index is the weighted average of the factors with data. Set a weight to 0 to ignore a factor.

Ranking

Index map

lowerhigher indexMontana outline

Montana: the Invest In Veterans Week four-peat

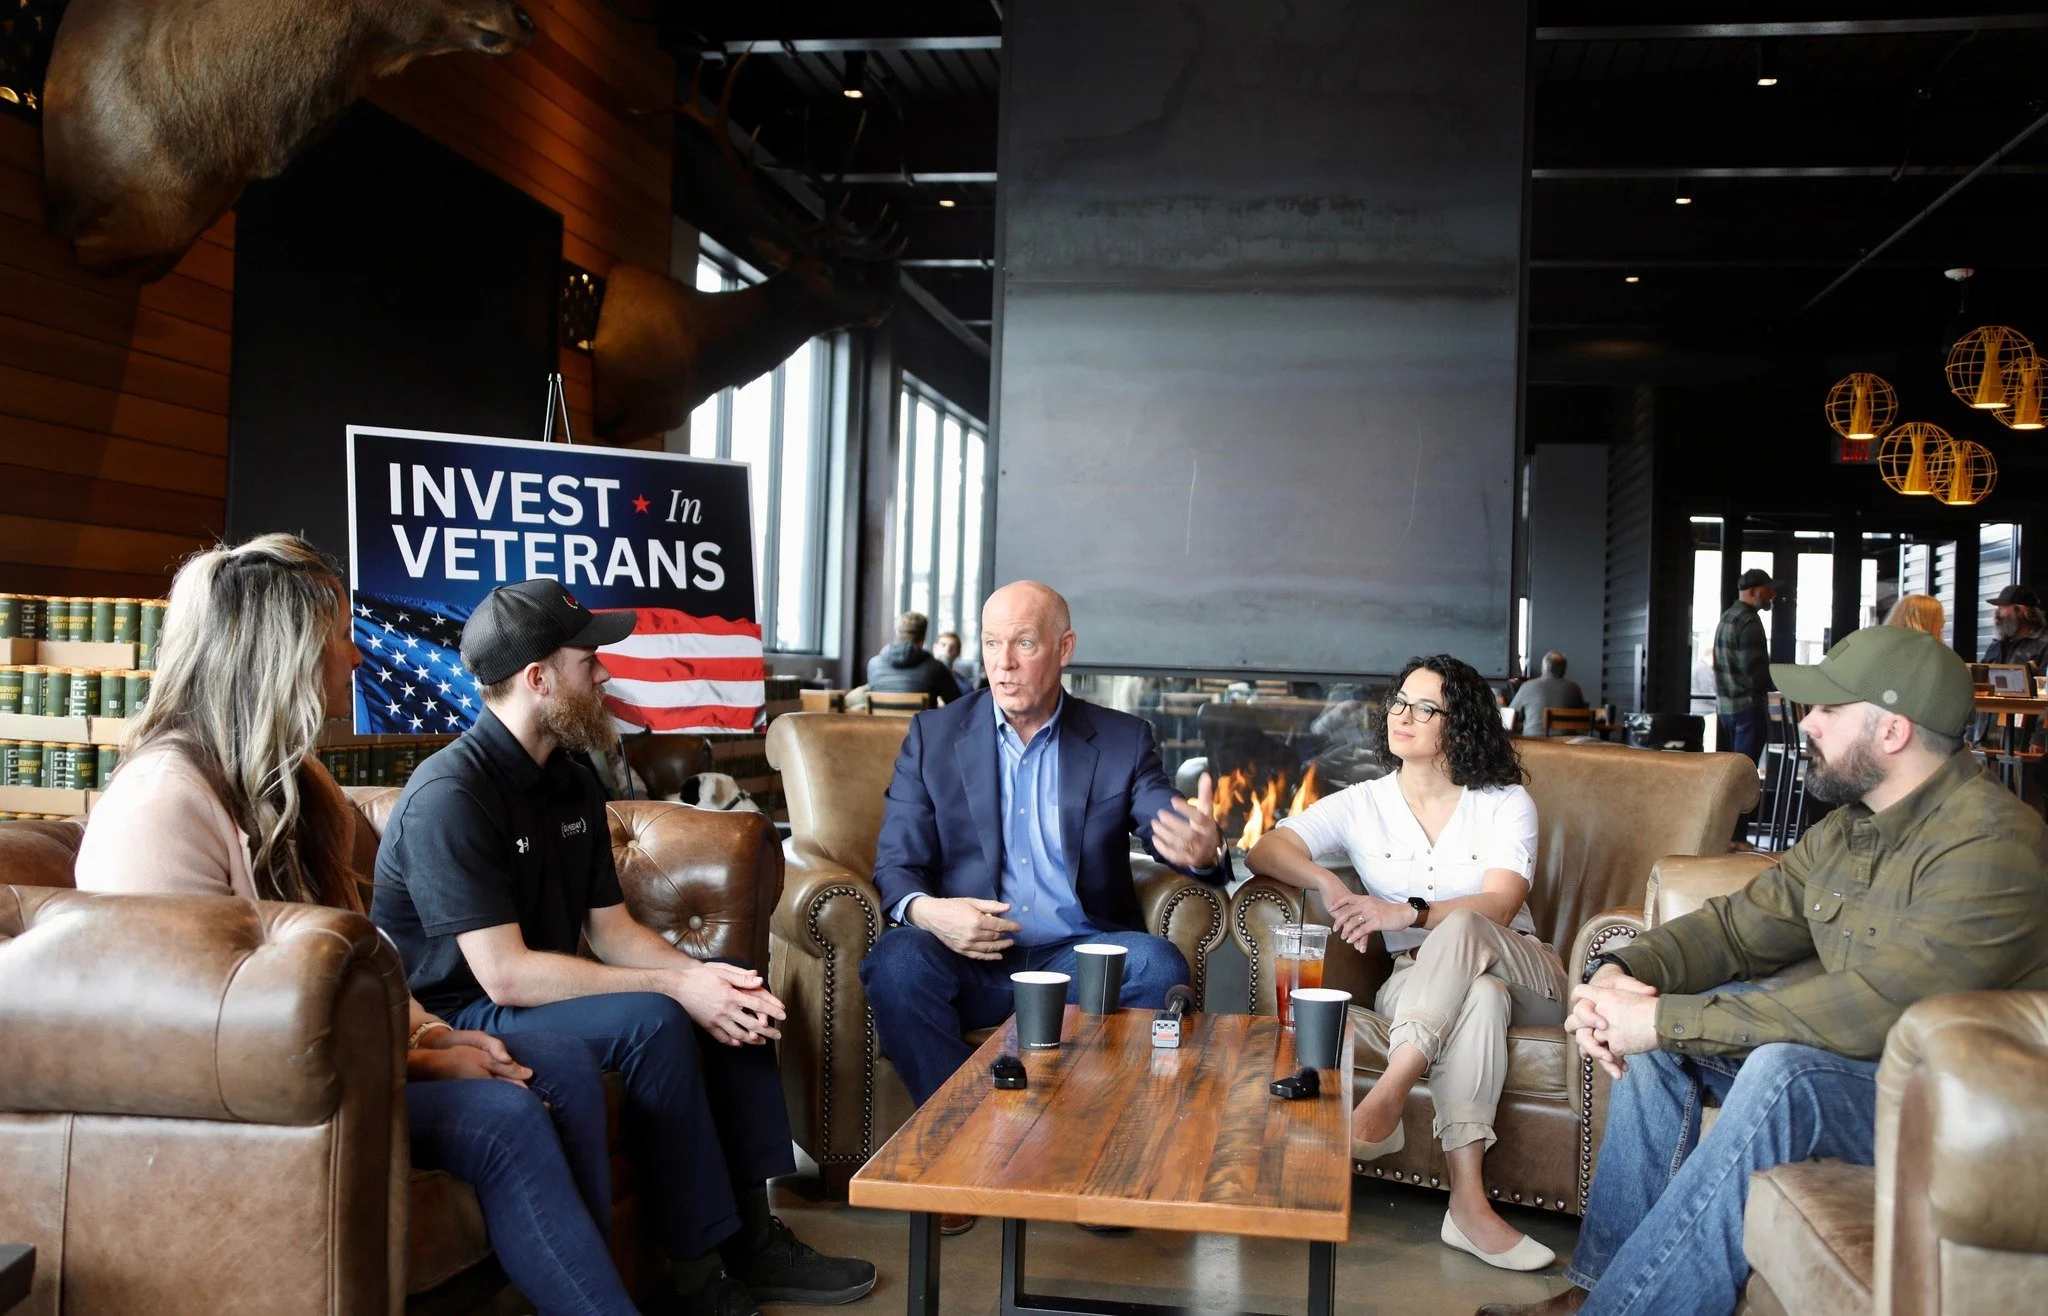
Gov. Greg Gianforte proclaimed Invest in Veterans Week four years running. Montana's congressman entered it in the Congressional Record, and a veteran state legislator who backed it now runs the state Commerce Department. Montana ranks first on official support, first for rural builders and near the top for veteran share, veteran jobs and new-firm momentum.

Montana's factor percentiles

Gold bar: Montana. Tick: the 50-state median, which is 50 by construction.

Montana's rank under each founder profile

Montana's gap is broadband: 92.7% of households, 43rd of 50. Closing it would lift every profile.

Comrades: where the veterans are

Most veterans

Veterans 18 and over, thousands (BLS, 2025 annual averages).

Highest veteran share

Veterans as a share of the civilian population (Census ACS, 2023).

Veteran unemployment

Lowest and highest published rates, 2025. Eight states fall below BLS publication standards.

Peers and momentum: certified veteran-owned businesses

Certified VOBs per 1,000 veterans

SBA VetCert firms with a public location (2026-10-04) per thousand veterans. More peers means more teaming partners, and more competition.

Momentum: share founded 2021 or later

States where today's certified firms are youngest.

Veterans vs. certified firms

Each dot is a state, log scales. Above the line: more certified firms than the national ratio predicts.

Invest In Veterans Week support by state

Points for each official action on record: governor proclamation 3, legislature resolution adopted 6 or introduced 3, Congressional Record entry 2, statewide official or county proclamation 2, member of Congress, legislator or county official message 1, governor mention 1.

Support points

Actions on record

StateYearActionPts

Rural business and broadband

Broadband vs. rural signal

X: households with broadband and a device (ACS 2024). Y: certified firms with no recorded metro area, a rural signal that also includes some missing entries (DC, fully urban, shows 20%).

Lowest broadband states

Where an online-first veteran business faces the weakest home connectivity.

Military spouses: measurable talent, mobile careers

Military spouses bring degrees, licenses and remote-ready skills, and carry moves, child care and caregiving. These measures show what a spouse founder brings and what slows them down.

Spouse education

Highest education of active duty spouses, 2024 survey.

Career and family load

Most military spouses

Active duty and Guard/Reserve spouses by state, 2023.

Active duty spousesGuard and Reserve spouses

Spouse founder states

Most military spouses per 1,000 residents, with household broadband for remote work.

StateSpouses per 1,000BroadbandSpouses per certified VOB

Find states for your trade

Most certified firms

Highest share of the state's firms

Share among states with 50 or more certified firms. Keyword estimates from firm names and narratives.

Evidence crosswalk

IDFindingValuePeriodSource

Dataset catalog

Ten datasets joined on state, plus one combined JSON file and a zip of every CSV. Free to use with attribution under CC BY 4.0.

Cite this release

Shuford, J. (2026). Veteran Founder Relocation Index (Version 2026.10.22) [Data set]. Veteran Business Super Intelligence, sponsored by National Invest In Veterans Week. https://www.veteranbusiness.si/veteran-founder-relocation-index

Method and definitions

Percentile
A state's position among the 50 states on one factor, from 0 to 100. Ties share a position. For veteran unemployment, lower rates score higher.
Index
Weighted average of factor percentiles with data. States missing a factor are scored on the others. The District of Columbia is excluded because several sources do not report it.
Comrades
Veteran count (BLS Current Population Survey, 2025 annual averages over 11 months) and veteran share of the civilian population (Census ACS 2023 five-year).
Defense demand
Active duty personnel per 1,000 residents (December 2023), a proxy for installation buying and military families nearby.
Taxes
70 points for no state tax on wages (AK, FL, NV, NH, SD, TN, TX, WA, WY) and 30 for no statewide sales tax (AK, DE, MT, NH, OR).
Rural signal
Share of certified firms with no metropolitan area recorded in the SBA export. It mixes rural firms with missing entries, so read it as relative, not absolute.
NIVW support
Points for official actions on record, listed in the support dataset. It measures public support for the week, not policy quality.
Limits
Sources cover different years (2022 to 2026). Certified firms are a subset of all veteran-owned businesses. The index is a planning aid, not advice to move; costs, family and markets vary by city.
SI (Super Intelligence)
A public intelligence system built from government datasets and documentary evidence, with analytical interfaces layered over the data.

Sources: SBA VetCert certified-firm export (2026-10-04); BLS Table 6A, Employment status of veterans by state, 2025; Census ACS 2023 five-year via CensusDepth; Census ACS 2024 one-year via America's Health Rankings; Military Officers Association of America state demographics (DoD active duty Dec 2023, DoD retirees Jan 2023, population 2024); 2023 Demographics Profile spouse counts; DoD Office of People Analytics, 2024 Active Duty Spouse Survey; RAND Corporation (2024); U.S. Military Spouse Chamber of Commerce via Air & Space Forces Magazine; IVMF; VA Office of Rural Health via We Honor Veterans; FCC via Benton Institute; Montana Governor's proclamations 2023 to 2026; Congressional Record H1049; SC H. 3825; PA SR 234; Advocate Atlas.

Veteran Business Super Intelligence℠ · Sponsored by National Invest In Veterans Week® · Data and text CC BY 4.0, Jeff Shuford · veteranbusiness.si

Government Impact Advocates

📡

SIGNAL_CLARITY // MONTANA_FEED

FILTERING NOISE... ISOLATING SUPPORT SIGNALS
SIGNAL LOCK: OPTIMAL
>> INCOMING EXECUTIVE TRANSMISSION
MT
GOV. GREG GIANFORTE STATE OF MONTANA

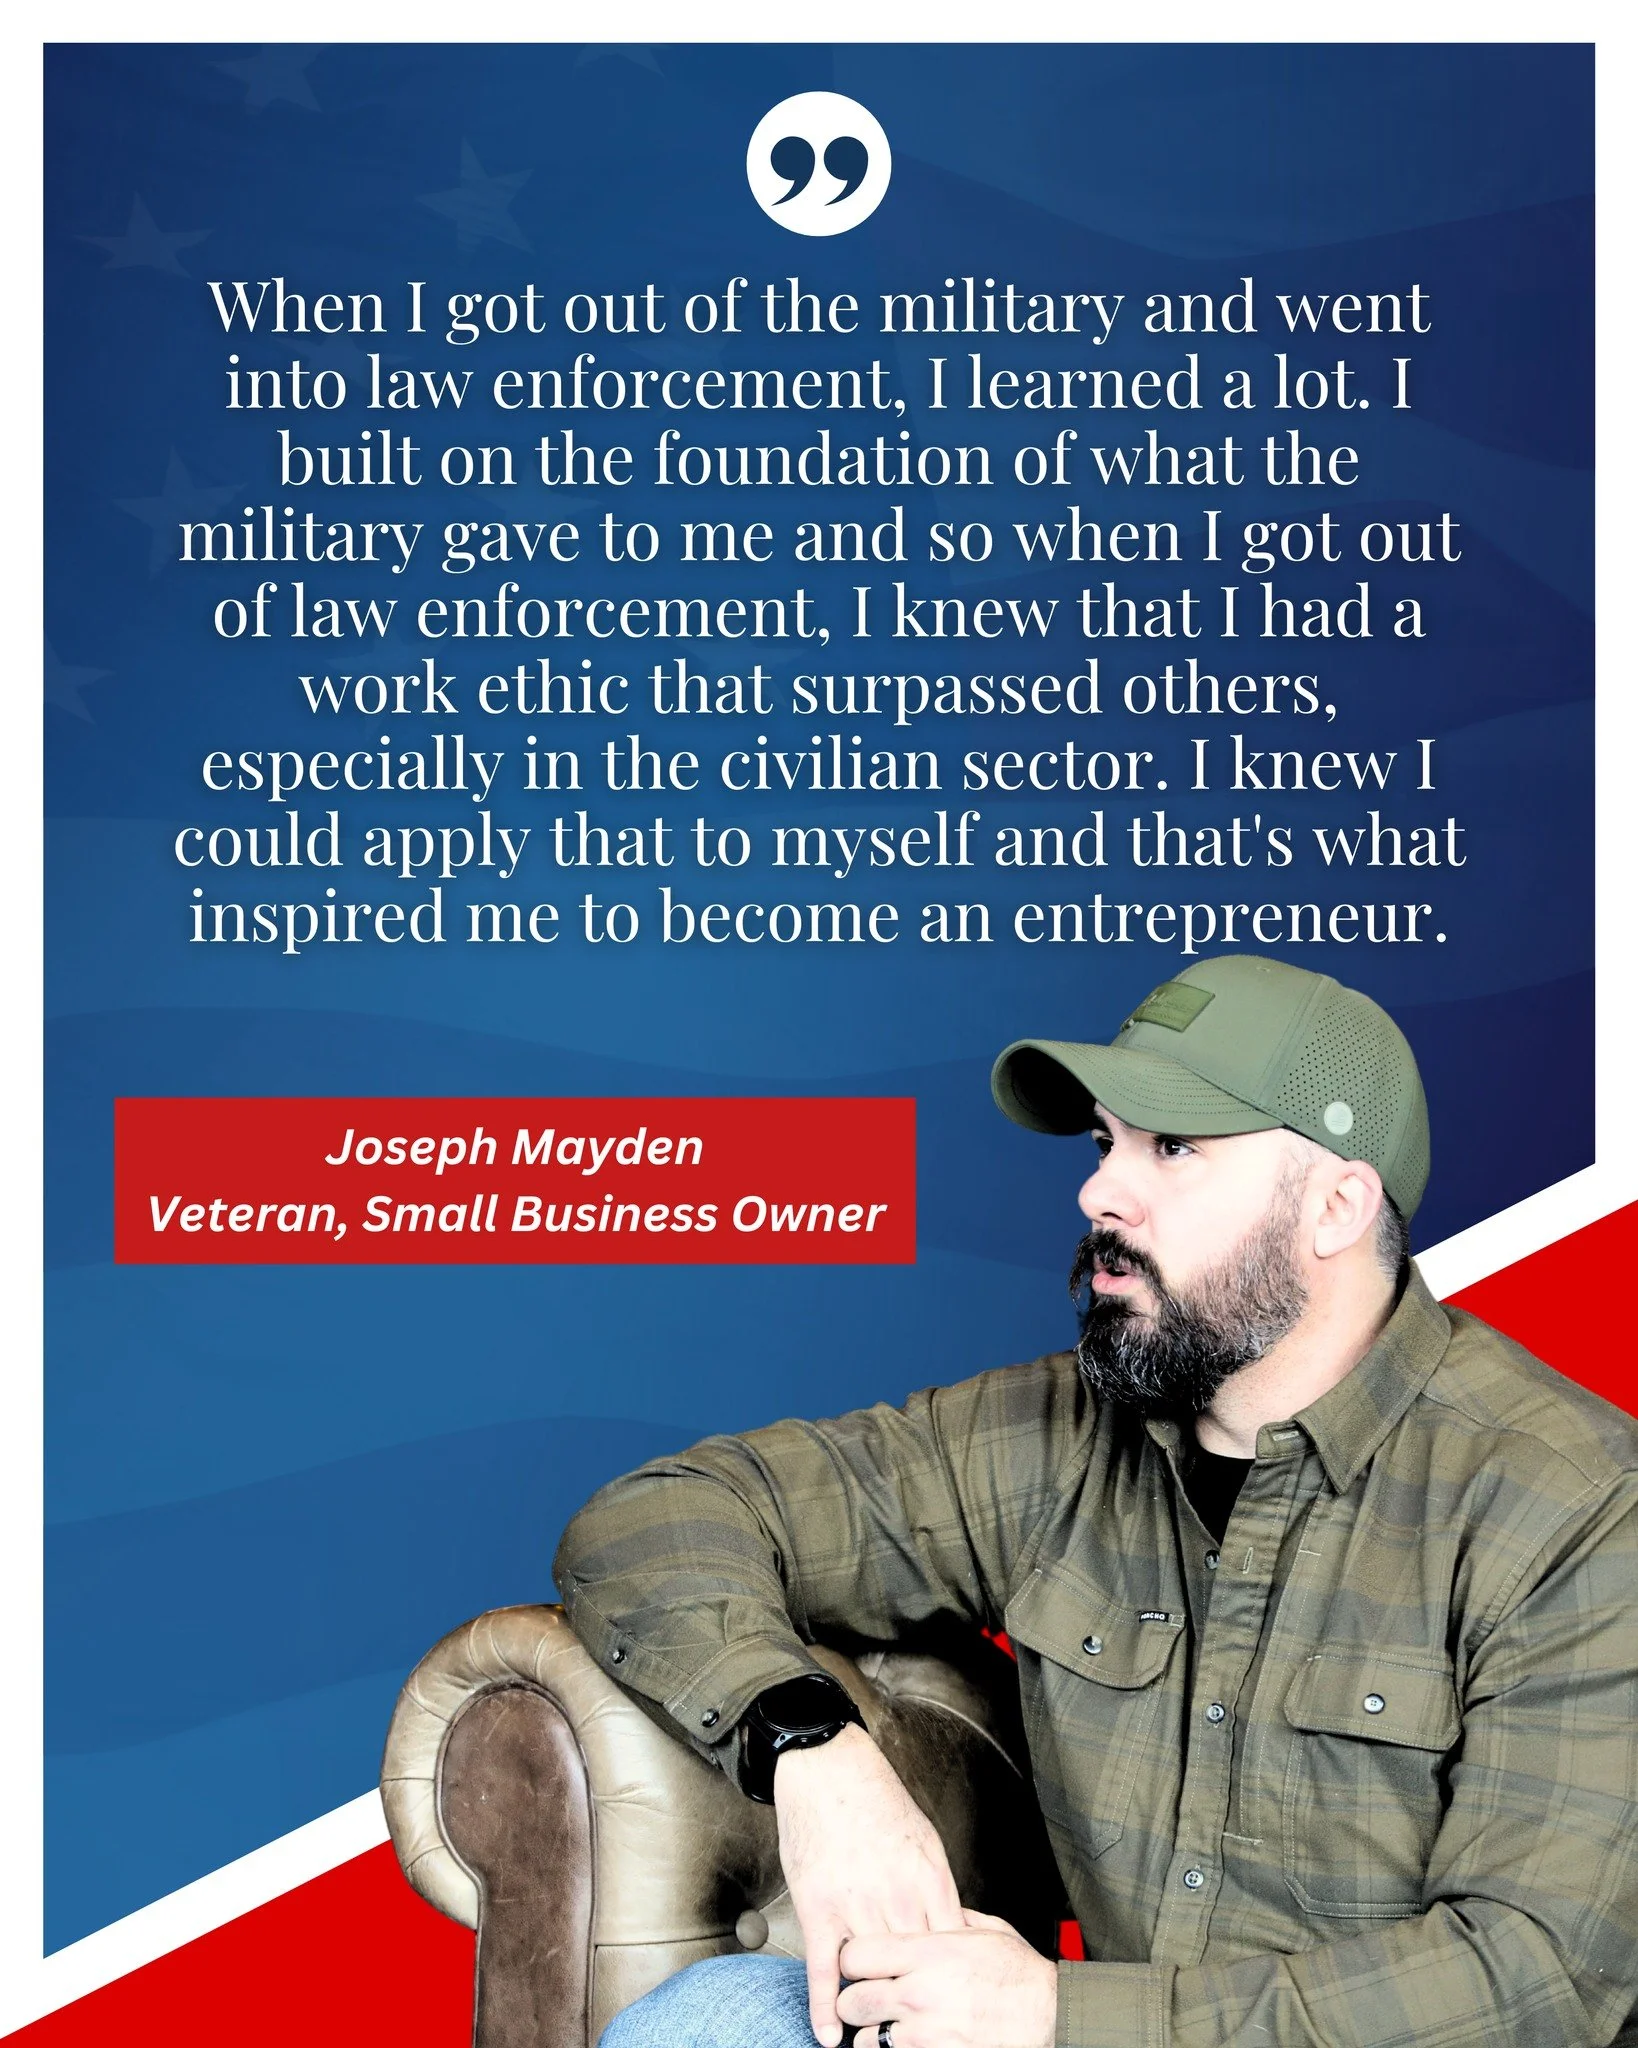
"Veteran small business owners like Joseph are critical to Montana. That's why we're committed to tearing down barriers to opportunity for our veterans as they invest in our communities."

TARGET: Veteran Entrepreneurs
MISSION: Removing Barriers
VERIFY SOURCE FEED ↗
DECRYPTED_CITIZEN_RESPONSES ● LIVE
JOSEPH VENTURA 🙏 COMMUNITY_SUPPORT

"God bless his efforts. God bless you Governor Gianforte."

CARL HILL ⚖️ POLICY_SIGNAL

"Can we do something about businesses not honoring veterans preference when hiring?? It’s still the good old boys club with unfair hiring practices."

>> INTEL: WORKFORCE BARRIER IDENTIFIED
HEATH CAMERON 📊 RECRUITING_DATA

"Did you also notice last month reversed the trend with a 15 year high in recruiting? Veterans know."

NOISE FILTER ACTIVE POLITICAL STATIC REMOVED
HQ: WASHINGTON DC LOADING... EST (UTC-5)
OPS: ZULU / UTC LOADING... UNIVERSAL TIME
FWD: BRUSSELS LOADING... NATO (CET)
PAC: INDOPACOM LOADING... HST (UTC-10)
Jeff Shuford Works Dataset
VETERAN BUSINESS SUPER INTELLIGENCE℠ · SPONSORED BY NATIONAL INVEST IN VETERANS WEEK® · DATASET 2026.10.22
Vetrepreneur Intelligence · Author dataset

Jeff Shuford: Published Works, 2018 to 2026

An open index of the articles and columns Muck Rack lists under Jeff Shuford's byline from 2018 onward, by outlet, year and topic. Titles and outlets only. Free to use with attribution under CC BY 4.0.

Works by year

Works by outlet

Works by topic

Every work

IDTitleOutletDateTopic

Download the CSV · Cite: Shuford, J. (2026). Jeff Shuford Published Works, 2018-2026 (Version 2026.10.22) [Data set]. Veteran Business Super Intelligence.

Method: compiled from Jeff Shuford's Muck Rack author profile. Duplicates removed. Where Muck Rack shows a date, it is used; otherwise the year is estimated from Muck Rack's "years ago" label as of October 2026 and the date column says "est.". Topics are keyword tags on titles.

Veteran Business Super Intelligence℠ · Sponsored by National Invest In Veterans Week® · investinveteransweek.com

Financial Impact Advocates

VBSI Open Data Vault
VETERAN BUSINESS SUPER INTELLIGENCE℠ · SPONSORED BY NATIONAL INVEST IN VETERANS WEEK®OPEN DATA VAULT 2026.10.22 · DATASETS · ROWS
Vetrepreneur Intelligence · Open data, volume 3

VBSI Open Data Vault

Fourteen more datasets for veteran entrepreneurs: SBA and USDA lending to veterans, federal training reach, Federal Reserve credit conditions for veteran-owned employers, Census ownership change, financial resilience, congressional districts, capabilities by certification, profile activity, AI and SI firm projections, military installations and the SI Desert Index.

Capital: SBA and USDA lending to veterans

VBSI-VAULT-SBA-LOANS

SBA loans to veterans, FY2019 to FY2024

7(a), SBA Express, 504 and Microloan approvals to veterans. Bar: total loans. Label: veterans' share of all loans in the three programs.

VBSI-VAULT-SBA-AVERAGE

Average approved loan, veteran vs. nonveteran

FY2019 to FY2024 averages. Veterans borrow less in 7(a) and 504 and more in SBA Express and Microloan.

VeteranNonveteran
VBSI-VAULT-USDA-FARM

USDA farm loans approved for veterans

Five Farm Service Agency programs. Approvals fell 22% from 2019 to 2024 while the veteran share held near 3.3%.

VBSI-VAULT-TRAINING

Federal training reach

Boots to Business attendees by fiscal year, and the latest year for eight programs.

Credit and conditions: veteran-owned employer firms

VBSI-VAULT-SBCS-VETERAN

Majority veteran-owned vs. no veteran ownership

Federal Reserve Small Business Credit Survey, 2024 survey year, employer firms. Gold dot: majority veteran-owned. Gray dot: no veteran ownership.

Majority veteran-owned (51%+)No veteran ownership
VBSI-VAULT-FINRA

Veteran financial resilience

FINRA Foundation segments. From 2018 to 2024, Standing Strong fell from 48% to 45% of veterans and Living on the Edge rose from 20% to 23%.

VBSI-VAULT-ABS-CHANGE

Census: veteran employer firms by industry, 2017 to 2020

SBA Office of Advocacy analysis of the Annual Business Survey. Veteran-owned employer firms fell 11.5% while nonveteran firms grew 3.0%, in all industries and in the five largest veteran industries shown.

Veteran-ownedNonveteran-owned

Certified firms: capabilities, districts and structure

VBSI-VAULT-CAP-CERT

Certifications by line of work

Share of certified firms in each line of work holding each certification. Darker is higher within the column.

VBSI-VAULT-DISTRICTS

Top congressional districts

VBSI-VAULT-STRUCTURE

Sole proprietorships by state

Highest share of certified firms organized as sole proprietorships, states with 100+ firms. The national share is %.

Momentum and strategic ground

VBSI-VAULT-AI-SI

Veteran AI and SI firms: 2026 to 2040

Top 10 states. Gray: certified firms describing AI or SI work today. Blue: base-scenario projection for 2040 (new firms grow 8% a year, 4% exit). A what-if, not a forecast.

VBSI-VAULT-ACTIVITY

Profile update activity

Certified firms by the month their SBA profile was last updated, January 2024 to September 2026 (snapshot of October 4, 2026).

VBSI-VAULT-INSTALLATIONS

Installations and the nearest business desert

89 major installations at approximate coordinates. Closest to a business-desert state center:

VBSI-VAULT-DESERT-INDEX

SI Desert Index: the ten lowest states

0 to 100: half density (firms per House seat), a quarter new-firm share, a quarter website share. Lower means fewer certified veteran firms for the population.

Download the vault

Each dataset above has a CSV file. All fourteen are also in one JSON file and one zip. Free to use with attribution under CC BY 4.0.

All files

Cite this release

Shuford, J. (2026). VBSI Open Data Vault (Version 2026.10.22) [Data set]. Veteran Business Super Intelligence, sponsored by National Invest In Veterans Week. https://www.investinveteransweek.com/vbsi-open-data-vault

Method and definitions

GAO tables
Tables 5, 6, 7 and 9 to 17 of GAO-25-107561 (September 2025), transcribed as published. SBA counts cover veteran owners only, not active duty, reservists or spouses.
SBCS figures
Read from the Federal Reserve's 2025 Chartbook on Veteran-owned Firms (2024 survey, employer firms, weighted to Census data). Values are rounded percentages as printed.
Certified-firm tables
Built from the SBA VetCert export of October 4, 2026. Lines of work are keyword estimates; a firm can match several. Counts under 5 appear as <5.
AI and SI firms
Certified firms whose public narrative or trade name describes AI or intelligence-system work. Projections are scenarios, not forecasts.
Installations
Approximate coordinates and names as of 2025. Distances are straight-line miles to the center of the nearest business-desert state.
SI (Super Intelligence)
A public intelligence system built from government datasets and documentary evidence, with analytical interfaces layered over the data.

Sources: GAO-25-107561, Financial Literacy and Small Business Lending (Sept 2025); Federal Reserve Banks, 2025 Firms in Focus: Chartbook on Veteran-owned Firms; FINRA Investor Education Foundation, The Financial Resilience of U.S. Veterans (May 2026); SBA Office of Advocacy Issue Brief 18 (2023); SBA VetCert certified-firm export (2026-10-04).

Veteran Business Super Intelligence℠ · Sponsored by National Invest In Veterans Week® · Data and text CC BY 4.0, Jeff Shuford · investinveteransweek.com

QUICK LINKS

MARCH 1-7

Veteran Charity Impact Advocates

MARCH 1-7